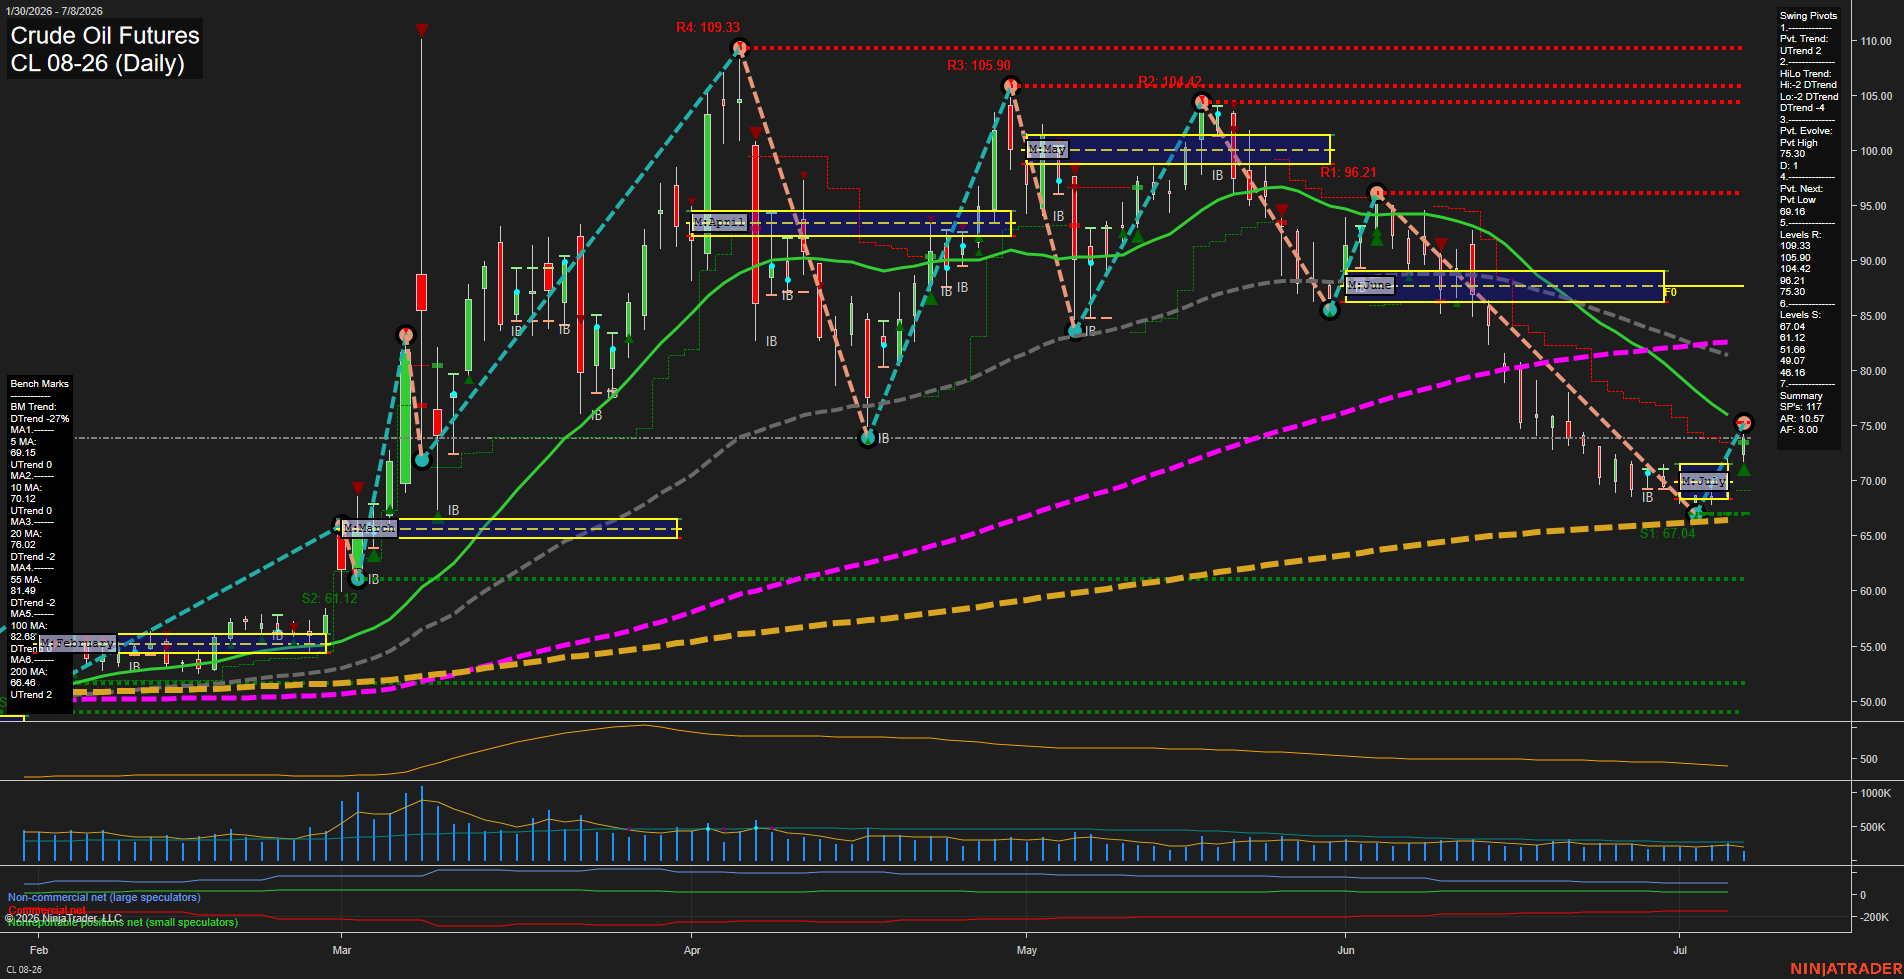
CL Crude Oil Futures Daily Chart Analysis: 2026-Jul-08 07:01 CT
Price Action
- Last: 75.30,
- Bars: Medium,
- Mom: fast.
WSFG Weekly
- Short-Term
- WSFG Current: 61%
- F0%/NTZ' Bias: Price Above,
- WSFG Trend: Up.
MSFG Month Jul
- Intermediate-Term
- MSFG Current: 15%
- F0%/NTZ' Bias: Price Above,
- MSFG Trend: Up.
YSFG Year 2026
- Long-Term
- YSFG Current: 81%
- F0%/NTZ' Bias: Price Above,
- YSFG Trend: Up.
Swing Pivots
- (Short-Term) 1. Pvt. Trend: UTrend,
- (Intermediate-Term) 2. HiLo Trend: DTrend,
- 3. Pvt. Evolve: Pvt high 75.30,
- 4. Pvt. Next: Pvt low 69.16,
- 5. Levels R: 109.33, 105.90, 104.42, 96.21, 75.30,
- 6. Levels S: 67.04, 61.12, 51.66, 49.07, 46.80.
Daily Benchmarks
- (Short-Term) 5 Day: 69.15 Up Trend,
- (Short-Term) 10 Day: 70.12 Up Trend,
- (Intermediate-Term) 20 Day: 76.02 Down Trend,
- (Intermediate-Term) 55 Day: 81.49 Down Trend,
- (Long-Term) 100 Day: 82.65 Down Trend,
- (Long-Term) 200 Day: 86.48 Up Trend.
Additional Metrics
- ATR: 10.57,
- VOLMA: 345883.
Recent Trade Signals
- 08 Jul 2026: Long CL 08-26 @ 72.76 Signals.USAR-MSFG
- 07 Jul 2026: Long CL 08-26 @ 70.04 Signals.USAR-WSFG
- 03 Jul 2026: Long CL 08-26 @ 69.2 Signals.USAR.TR120
Overall Rating
- Short-Term: Bullish,
- Intermediate-Term: Neutral,
- Long-Term: Neutral.
Key Insights Summary
Crude oil is in a strong short-term rebound structure after holding the low pivot near 67.04 and pushing back toward the 75 area. The pivot trend has turned up, and the recent signal sequence shows improving upside response across TR120, WSFG, and MSFG. Weekly, monthly, and yearly session fib grids all remain in positive alignment with price above the F0/NTZ bias, which supports the current recovery theme. At the same time, the benchmark moving averages still reflect a broader mixed-to-soft structure, with price back above the very short-term averages but still below the 20, 55, and 100 day benchmarks, keeping the intermediate backdrop more balanced than directional. The chart shows a sharp selloff into early July followed by a V-shaped rebound attempt and a test of prior swing levels, with overhead resistance clustered in the 75 to 96 zone and layered support below 70.
Chart Analysis ATS AI Generated: 2026-07-08 07:01 for Informational use only, not trading advice. Terms and Risk Disclosure Copyright © 2026. Algo Trading Systems LLC.