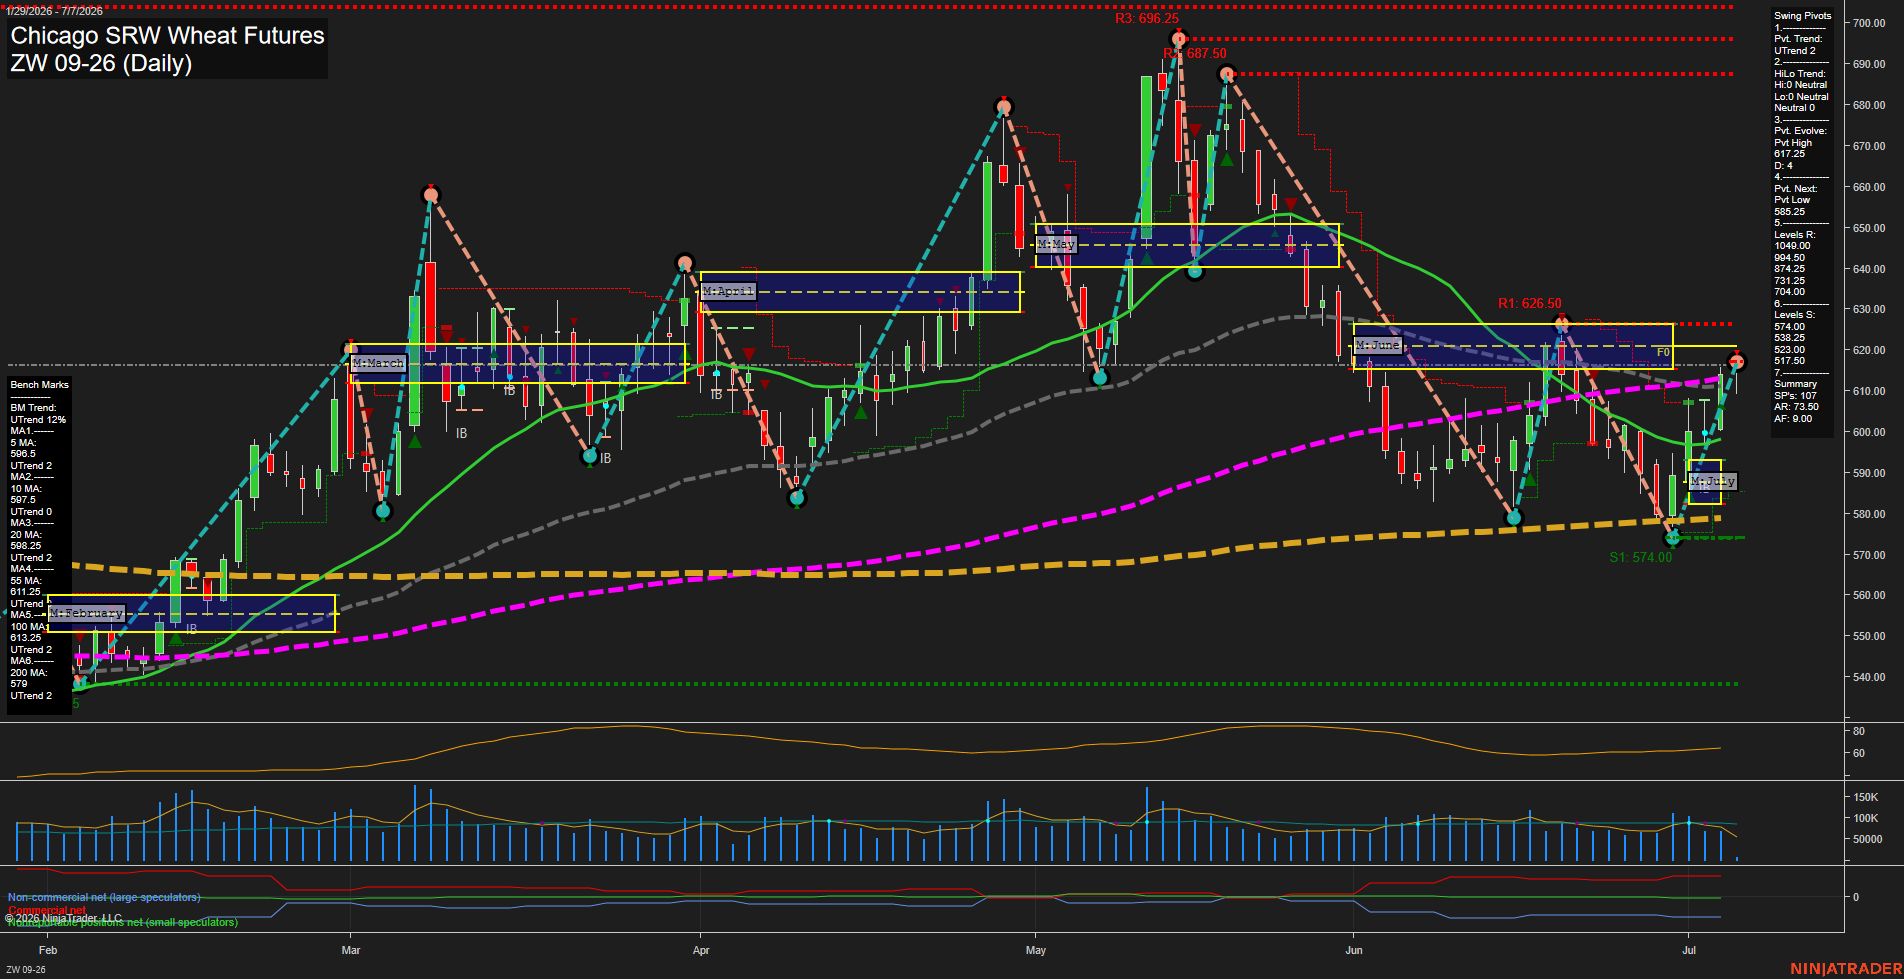
ZW Chicago SRW Wheat Futures Daily Chart Analysis: 2026-Jul-07 07:10 CT
Price Action
- Last: 617.25,
- Bars: Medium,
- Mom: Fast.
WSFG Weekly
- Short-Term
- WSFG Current: 45%
- F0%/NTZ' Bias: Price Above,
- WSFG Trend: Up.
MSFG Month Jul
- Intermediate-Term
- MSFG Current: 25%
- F0%/NTZ' Bias: Price Above,
- MSFG Trend: Up.
YSFG Year 2026
- Long-Term
- YSFG Current: 34%
- F0%/NTZ' Bias: Price Above,
- YSFG Trend: Up.
Swing Pivots
- (Short-Term) 1. Pvt. Trend: UTrend,
- (Intermediate-Term) 2. HiLo Trend: UTrend,
- 3. Pvt. Evolve: Pvt High 617.25,
- 4. Pvt. Next: Pvt Low 585.25,
- 5. Levels R: 1049.00, 994.50, 874.25, 731.25, 704.00,
- 6. Levels S: 574.00, 538.25, 523.00, 517.50.
Daily Benchmarks
- (Short-Term) 5 Day: 596.5 Up Trend,
- (Short-Term) 10 Day: 597.5 Up Trend,
- (Intermediate-Term) 20 Day: 598.25 Up Trend,
- (Intermediate-Term) 55 Day: 611.25 Up Trend,
- (Long-Term) 100 Day: 613.25 Up Trend,
- (Long-Term) 200 Day: 579 Up Trend.
Additional Metrics
Recent Trade Signals
- 06 Jul 2026: Long ZW 09-26 @ 606.5 Signals.USAR-MSFG
- 06 Jul 2026: Long ZW 09-26 @ 604.5 Signals.USAR-WSFG
- 01 Jul 2026: Long ZW 09-26 @ 593.5 Signals.USAR.TR120
- 29 Jun 2026: Short ZW 09-26 @ 582.25 Signals.USAR.TR720
Overall Rating
- Short-Term: Bullish,
- Intermediate-Term: Bullish,
- Long-Term: Bullish.
Key Insights Summary
Price is holding a constructive recovery above the weekly, monthly, and yearly fib session bias, with the market pressing back into the 617 area after a sharp June decline and rebound sequence. The swing pivot structure remains in UTrend, and the most recent pivot action shows a completed push to a high at 617.25 with the next downside pivot reference at 585.25, framing the current trade as a range-to-recovery phase rather than a clean trend failure. Daily benchmarks are stacked positively, with price above the 5, 10, 20, 55, 100, and 200-day references, which supports a firm underlying tape even though the chart still reflects prior volatility and a broad swing structure. The recent signal flow has turned more constructive across short-term and intermediate-term systems, while the long-term signal history has already shifted away from the late-June downside posture. Overall, the chart shows a bullish recovery attempt with higher reaction points, improved momentum, and a market trying to sustain a breakout rebound inside a still-active larger swing framework.
Chart Analysis ATS AI Generated: 2026-07-07 07:11 for Informational use only, not trading advice. Terms and Risk Disclosure Copyright © 2026. Algo Trading Systems LLC.