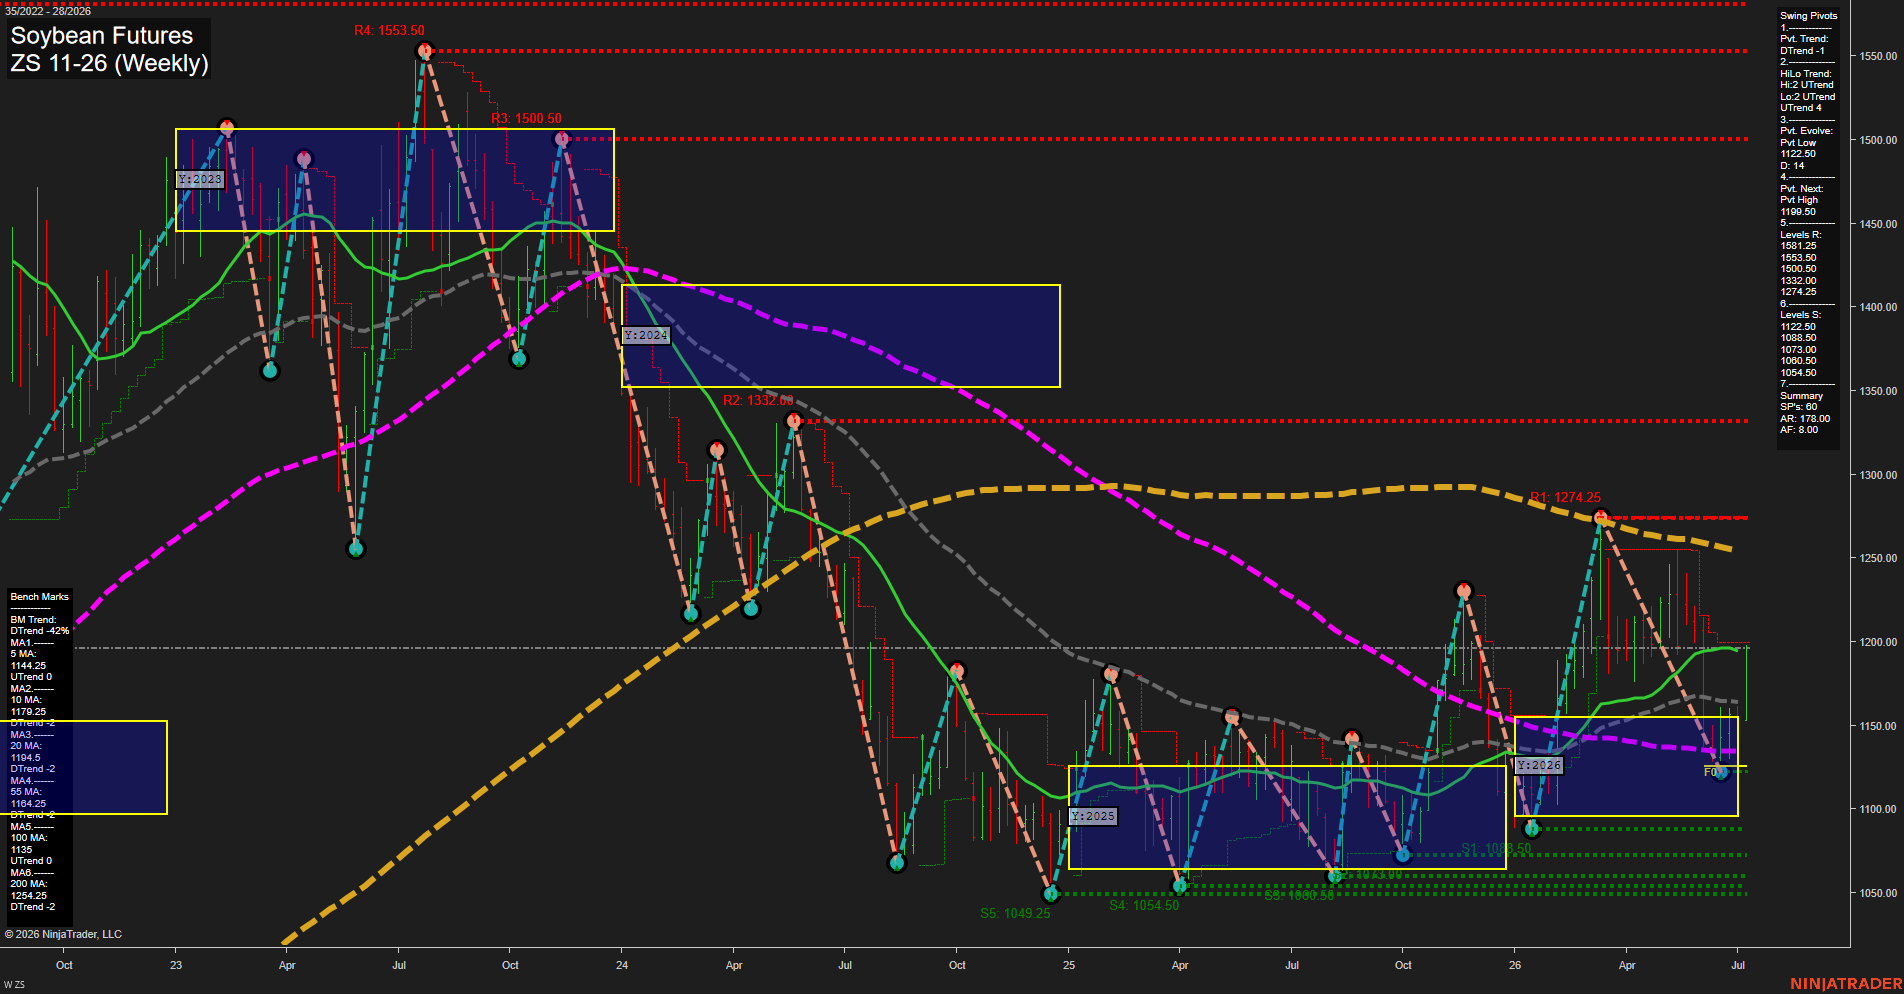
ZS Soybean Futures Weekly Chart Analysis: 2026-Jul-07 07:10 CT
Price Action
- Last: 1144.25,
- Bars: Small,
- Mom: slow.
WSFG Weekly
- Short-Term
- WSFG Current: 142%
- F0%/NTZ' Bias: Price Above,
- WSFG Trend: Up.
MSFG Month Jul
- Intermediate-Term
- MSFG Current: 65%
- F0%/NTZ' Bias: Price Above,
- MSFG Trend: Up.
YSFG Year 2026
- Long-Term
- YSFG Current: 24%
- F0%/NTZ' Bias: Price Above,
- YSFG Trend: Up.
Swing Pivots
- (Short-Term) 1. Pvt. Trend: DTrend,
- (Intermediate-Term) 2. HiLo Trend: UTrend,
- 3. Pvt. Evolve: Pvt Low 1122.50,
- 4. Pvt. Next: Pvt High 1199.50,
- 5. Levels R: 1581.25, 1553.50, 1500.50, 1332.00, 1274.25,
- 6. Levels S: 1122.50, 1088.50, 1073.00, 1060.50, 1054.50.
Weekly Benchmarks
- (Short-Term) 5 Day: 1144.25 Up Trend,
- (Short-Term) 10 Day: 1179.25 Down Trend,
- (Intermediate-Term) 20 Day: 1194.50 Down Trend,
- (Intermediate-Term) 55 Day: 1164.25 Down Trend,
- (Long-Term) 100 Day: 1135.00 Down Trend,
- (Long-Term) 200 Day: 1254.25 Down Trend.
Recent Trade Signals
- 01 Jul 2026: Long ZS 11-26 @ 1159 Signals.USAR-MSFG
- 01 Jul 2026: Long ZS 11-26 @ 1147.75 Signals.USAR.TR120
Overall Rating
- Short-Term: Neutral,
- Intermediate-Term: Bullish,
- Long-Term: Neutral.
Key Insights Summary
Soybean futures are in a broad recovery phase after the major 2024-2025 decline, with price holding above the yearly, monthly, and weekly session fib midlines. The weekly structure is still messy at the short end because the current swing pivot trend is DTrend, but the intermediate HiLo pivot trend remains constructive and price is working through a lower-volatility consolidation around the 1140s. The chart shows a sequence of sharp swing reversals, indicating a choppy market rather than a clean impulse trend. Overhead resistance remains layered at 1199.50, 1274.25, and 1332.00, while support is clustered near 1122.50, 1088.50, and the 1060s. Benchmark moving averages are still mostly leaning lower on the higher-timeframe structure, but the current price is pressing back above key short-term benchmarks, which keeps the intermediate tone positive and the long-term tone more balanced than directional.
Chart Analysis ATS AI Generated: 2026-07-07 07:10 for Informational use only, not trading advice. Terms and Risk Disclosure Copyright © 2026. Algo Trading Systems LLC.