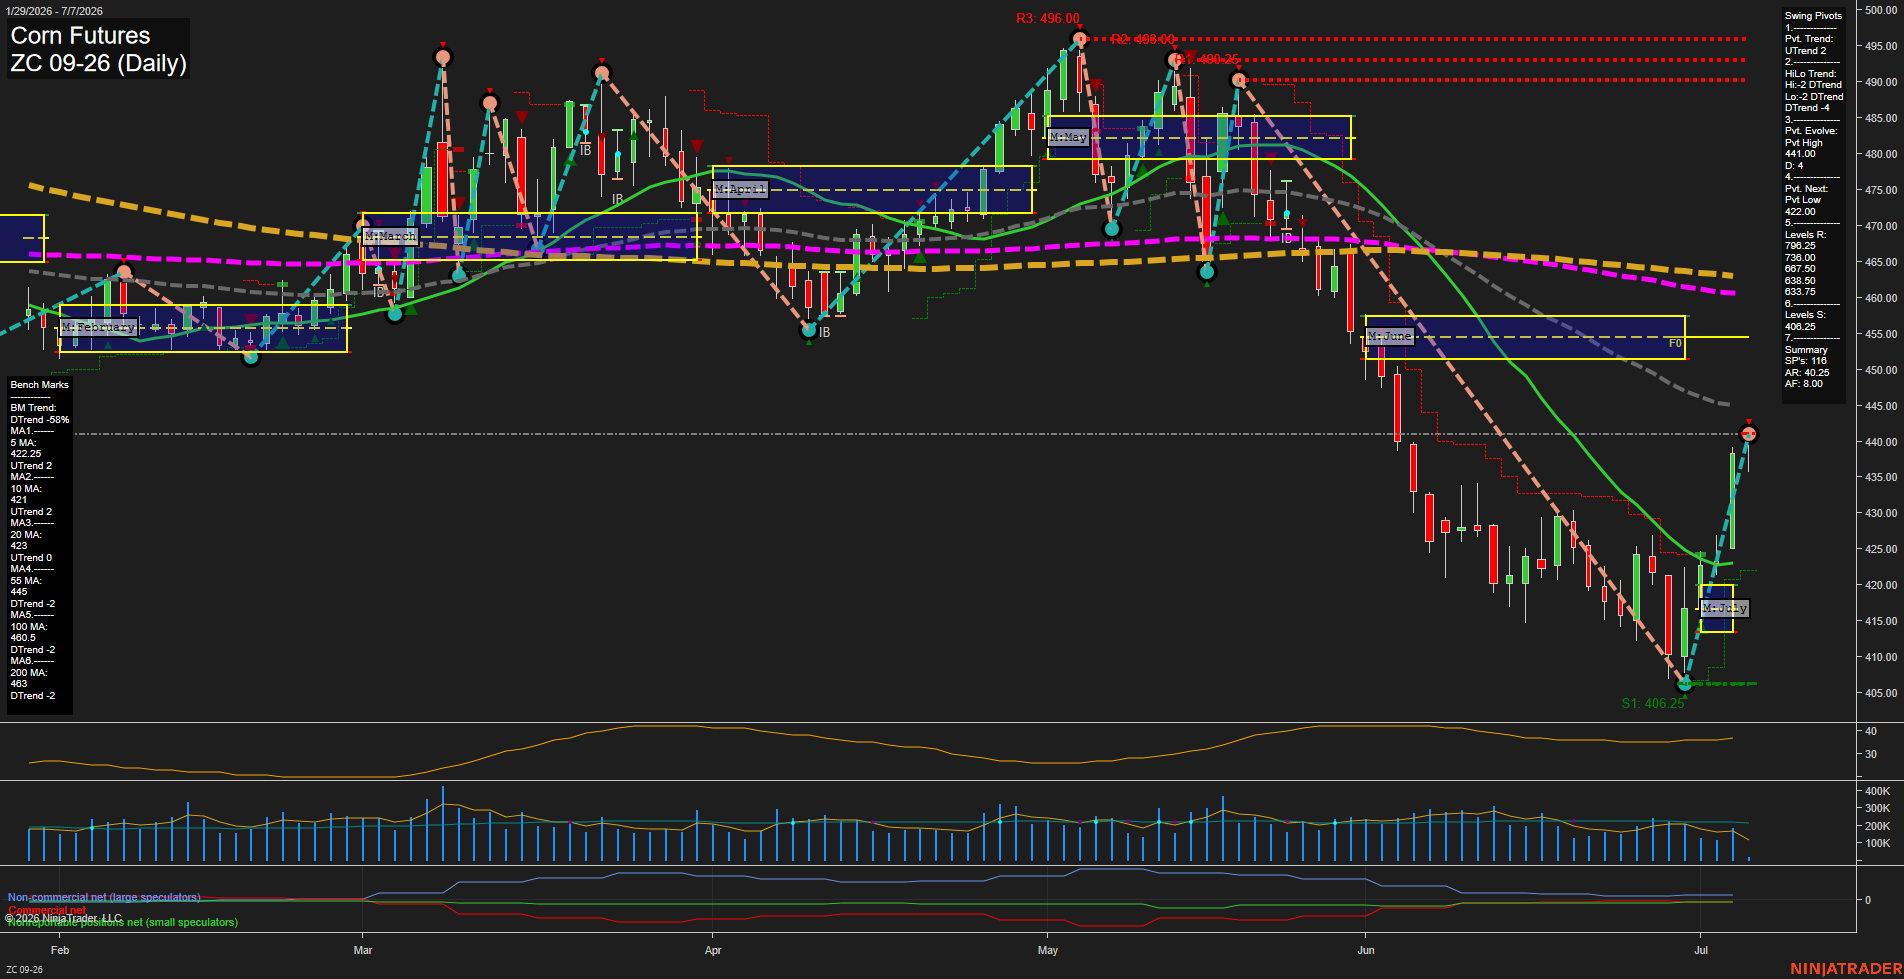
ZC Corn Futures Daily Chart Analysis: 2026-Jul-07 07:09 CT
Price Action
- Last: 440.25,
- Bars: Large,
- Mom: fast.
WSFG Weekly
- Short-Term
- WSFG Current: 92%
- F0%/NTZ' Bias: Price Above,
- WSFG Trend: Up.
MSFG Month Jul
- Intermediate-Term
- MSFG Current: 53%
- F0%/NTZ' Bias: Price Above,
- MSFG Trend: Up.
YSFG Year 2026
- Long-Term
- YSFG Current: -25%
- F0%/NTZ' Bias: Price Below,
- YSFG Trend: Down.
Swing Pivots
- (Short-Term) 1. Pvt. Trend: UTrend,
- (Intermediate-Term) 2. HiLo Trend: DTrend,
- 3. Pvt. Evolve: Pvt High 440.25,
- 4. Pvt. Next: Pvt Low 421.25,
- 5. Levels R: 798.25, 730.00, 667.50, 638.50, 633.75,
- 6. Levels S: 406.25.
Daily Benchmarks
- (Short-Term) 5 Day: 422.25 Up Trend,
- (Short-Term) 10 Day: 421.00 Up Trend,
- (Intermediate-Term) 20 Day: 423.00 Up Trend,
- (Intermediate-Term) 55 Day: 445.00 Down Trend,
- (Long-Term) 100 Day: 460.50 Down Trend,
- (Long-Term) 200 Day: 463.00 Down Trend.
Additional Metrics
Recent Trade Signals
- 06 Jul 2026: Long ZC 09-26 @ 430.25 Signals.USAR.TR720
- 02 Jul 2026: Long ZC 09-26 @ 423.75 Signals.USAR-WSFG
- 02 Jul 2026: Long ZC 09-26 @ 426.5 Signals.USAR-MSFG
Overall Rating
- Short-Term: Bullish,
- Intermediate-Term: Bearish,
- Long-Term: Bearish.
Key Insights Summary
Corn is showing a sharp daily rebound off the early-July selloff low near 406.25, with price now back above the weekly and monthly session fib references and pressing into a fast short-term recovery phase. The short-term pivot structure has turned UTrend, and the latest impulse has reclaimed the 5, 10, and 20 day benchmarks, signaling a strong counter-trend lift. Even so, the broader swing profile remains heavy because price is still below the 55, 100, and 200 day benchmarks, and the year-to-date session fib bias stays below F0%, keeping the long-term structure pointed down. The chart is in a transition zone where the rebound has shifted near-term tone bullish, while the larger trend remains corrective and downward within a broader recovery attempt from oversold levels.
Chart Analysis ATS AI Generated: 2026-07-07 07:10 for Informational use only, not trading advice. Terms and Risk Disclosure Copyright © 2026. Algo Trading Systems LLC.