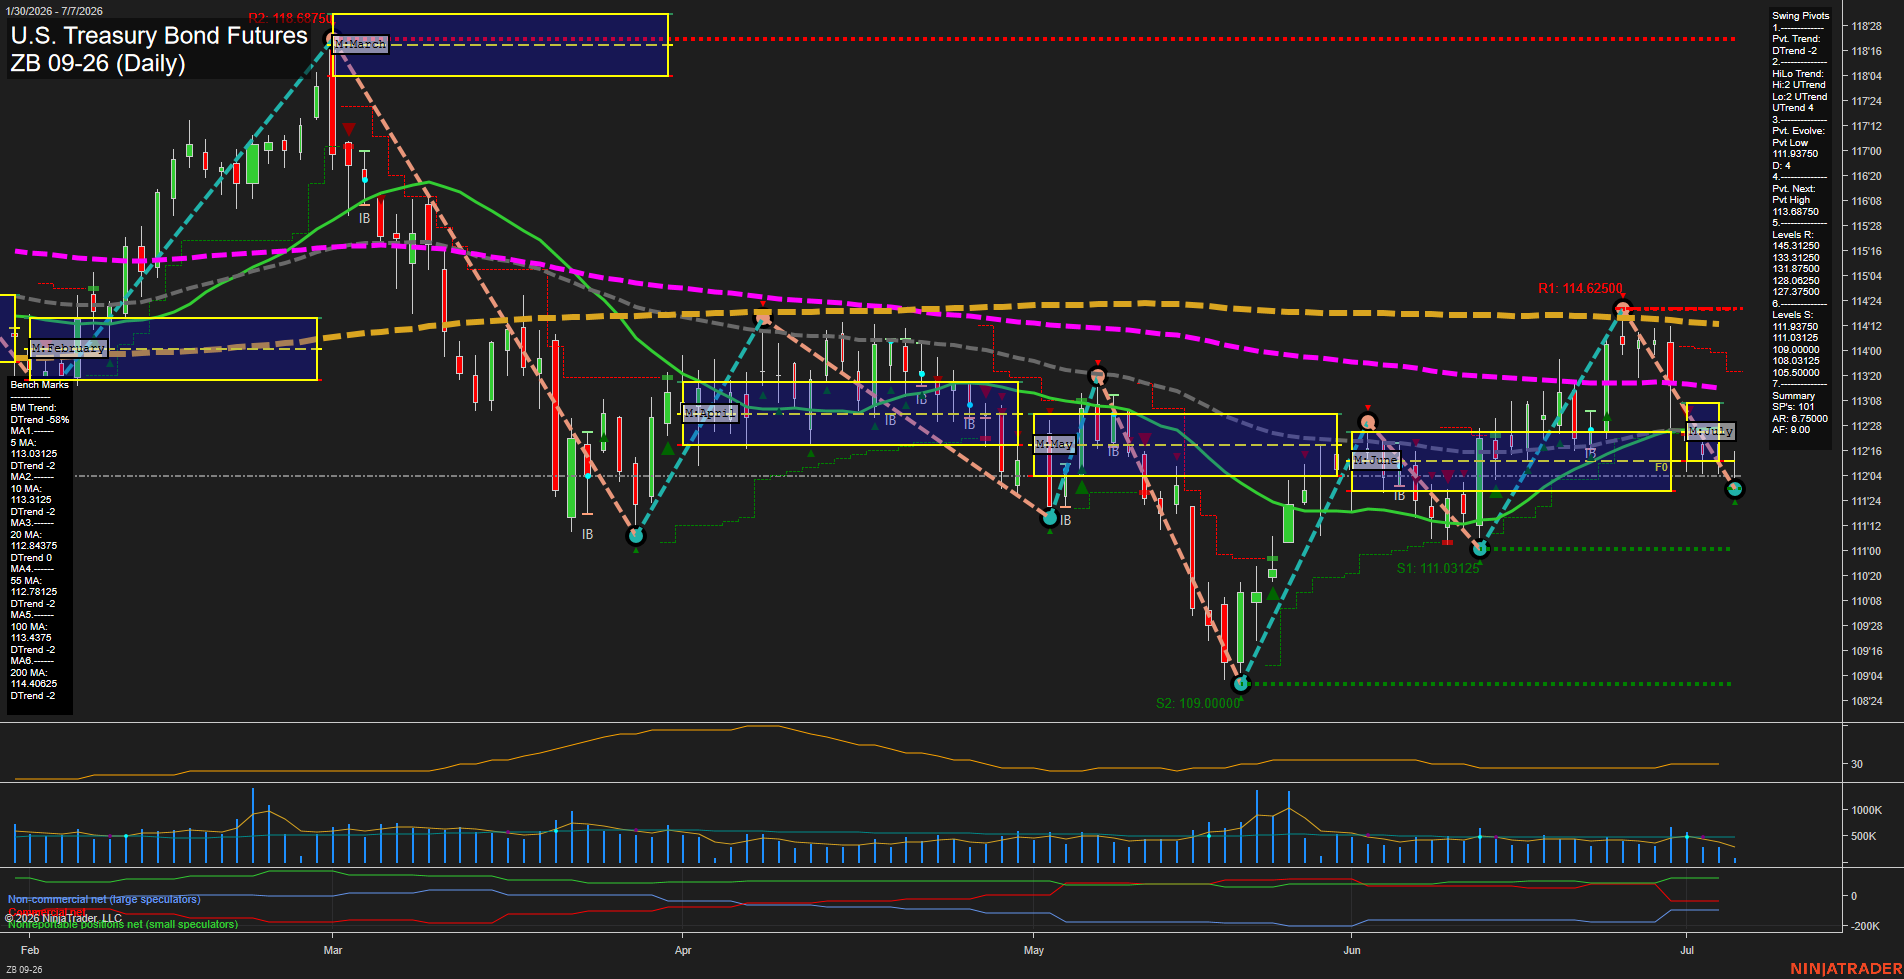
ZB U.S. Treasury Bond Futures Daily Chart Analysis: 2026-Jul-07 07:09 CT
Price Action
- Last: 111.31250,
- Bars: Medium,
- Mom: average.
WSFG Weekly
- Short-Term
- WSFG Current: NA%
- F0%/NTZ' Bias: Price Neutral,
- WSFG Trend: Neutral.
MSFG Month Jul
- Intermediate-Term
- MSFG Current: NA%
- F0%/NTZ' Bias: Price Neutral,
- MSFG Trend: Neutral.
YSFG Year 2026
- Long-Term
- YSFG Current: NA%
- F0%/NTZ' Bias: Price Neutral,
- YSFG Trend: Neutral.
Swing Pivots
- (Short-Term) 1. Pvt. Trend: DTrend,
- (Intermediate-Term) 2. HiLo Trend: UTrend,
- 3. Pvt. Evolve: Pvt Low 111.93750,
- 4. Pvt. Next: Pvt High 113.68750,
- 5. Levels R: 145.31250, 133.31250, 131.87500, 128.06250, 127.37500,
- 6. Levels S: 111.93750, 111.03125, 109.00000, 108.03125, 105.75000.
Daily Benchmarks
- (Short-Term) 5 Day: 113.03125 Down Trend,
- (Short-Term) 10 Day: 113.31250 Down Trend,
- (Intermediate-Term) 20 Day: 112.84375 Down Trend,
- (Intermediate-Term) 55 Day: 112.78125 Down Trend,
- (Long-Term) 100 Day: 113.43750 Down Trend,
- (Long-Term) 200 Day: 114.40625 Down Trend.
Additional Metrics
Overall Rating
- Short-Term: Bearish,
- Intermediate-Term: Bearish,
- Long-Term: Bearish.
Key Insights Summary
ZB remains in a broader downtrend with price trading below a clustered set of declining benchmark moving averages, confirming overhead supply and a persistent lower-high structure. The swing pivot model is aligned bearish on the short-term trend, while the intermediate HiLo structure still shows an uptrend read, reflecting a mixed but weakening rebound phase after the June selloff. Price has recovered off the early-June low near 109.00000 and is now testing the lower edge of the recent consolidation band near 111.93 to 113.69, with the latest action showing rejection from the prior recovery leg and a return toward support. The session fib grids and pivot map show a neutral monthly/weekly bias, but the daily tape is still dominated by failed rallies, inside-bar compression, and repeated tests of the same resistance zone, a classic retracement-and-rejection pattern after a sharp decline. Momentum is moderate rather than explosive, and the ATR reading points to continued active range rotation rather than a clean impulsive trend extension.
Chart Analysis ATS AI Generated: 2026-07-07 07:09 for Informational use only, not trading advice. Terms and Risk Disclosure Copyright © 2026. Algo Trading Systems LLC.