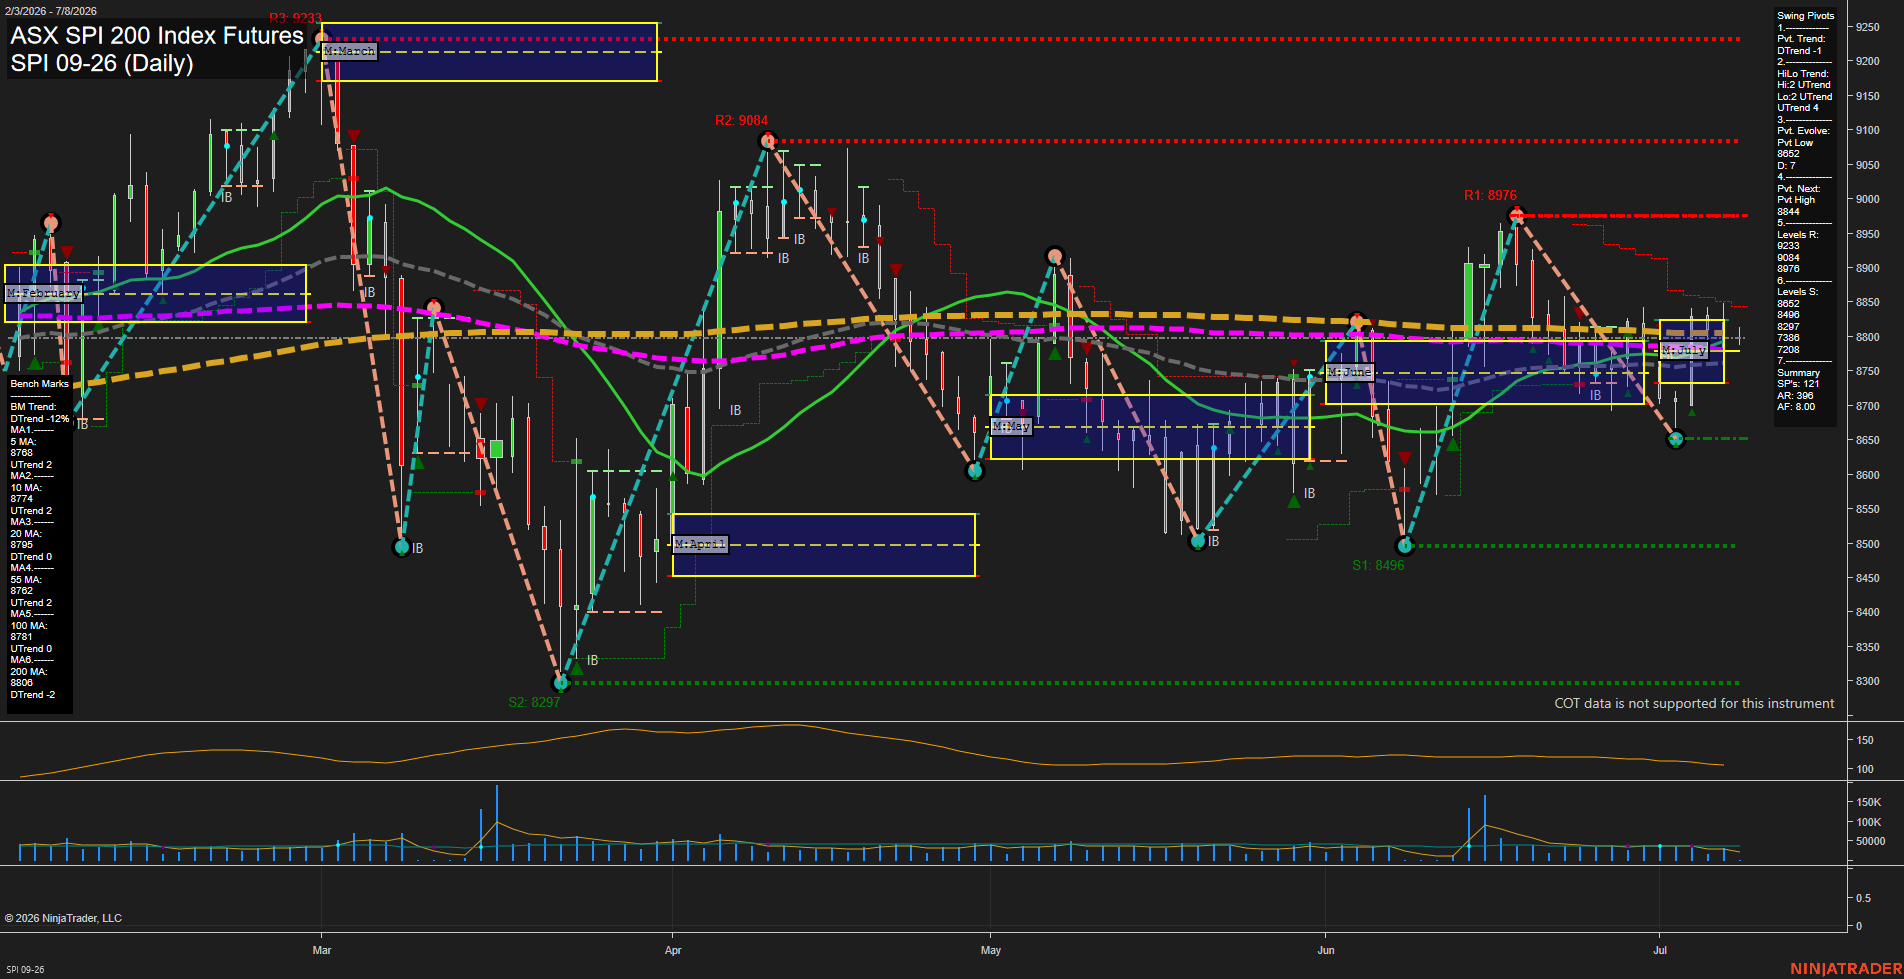
SPI ASX SPI 200 Index Futures Daily Chart Analysis: 2026-Jul-07 07:07 CT
Price Action
- Last: 8780,
- Bars: Large,
- Mom: average.
WSFG Weekly
- Short-Term
- WSFG Current: NA%
- F0%/NTZ' Bias: Price Neutral,
- WSFG Trend: Neutral.
MSFG Month Jul
- Intermediate-Term
- MSFG Current: NA%
- F0%/NTZ' Bias: Price Neutral,
- MSFG Trend: Neutral.
YSFG Year 2026
- Long-Term
- YSFG Current: NA%
- F0%/NTZ' Bias: Price Neutral,
- YSFG Trend: Neutral.
Swing Pivots
- (Short-Term) 1. Pvt. Trend: DTrend,
- (Intermediate-Term) 2. HiLo Trend: UTrend,
- 3. Pvt. Evolve: Pvt low 8652,
- 4. Pvt. Next: Pvt high 8844,
- 5. Levels R: 9233, 9084, 8976,
- 6. Levels S: 8652, 8496, 8297, 7386, 7208.
Daily Benchmarks
- (Short-Term) 5 Day: 8768 Up Trend,
- (Short-Term) 10 Day: 8774 Up Trend,
- (Intermediate-Term) 20 Day: 8795 Down Trend,
- (Intermediate-Term) 55 Day: 8762 Up Trend,
- (Long-Term) 100 Day: 8781 Down Trend,
- (Long-Term) 200 Day: 8806 Down Trend.
Additional Metrics
Overall Rating
- Short-Term: Neutral,
- Intermediate-Term: Neutral,
- Long-Term: Bearish.
Key Insights Summary
Price is trading in a wide, rotational swing structure with repeated monthly fib box interactions and multiple inside-bar pauses, showing a market that is cycling between thrusts and retracements rather than producing a clean trend. The short-term pivot state is still in DTrend, while the higher pivot structure remains mixed-to-rising, which keeps the daily tape balanced but fragile. Price sits close to the cluster of benchmark averages around the upper 8700s, with the 20-day and 200-day acting as overhead reference points and the recent swing highs at 8844 and 8976 defining the next resistance zones. Support remains layered below at 8652, 8496, and 8297, reflecting a market that has already completed several swing expansions and mean-reversion legs.
Chart Analysis ATS AI Generated: 2026-07-07 07:08 for Informational use only, not trading advice. Terms and Risk Disclosure Copyright © 2026. Algo Trading Systems LLC.