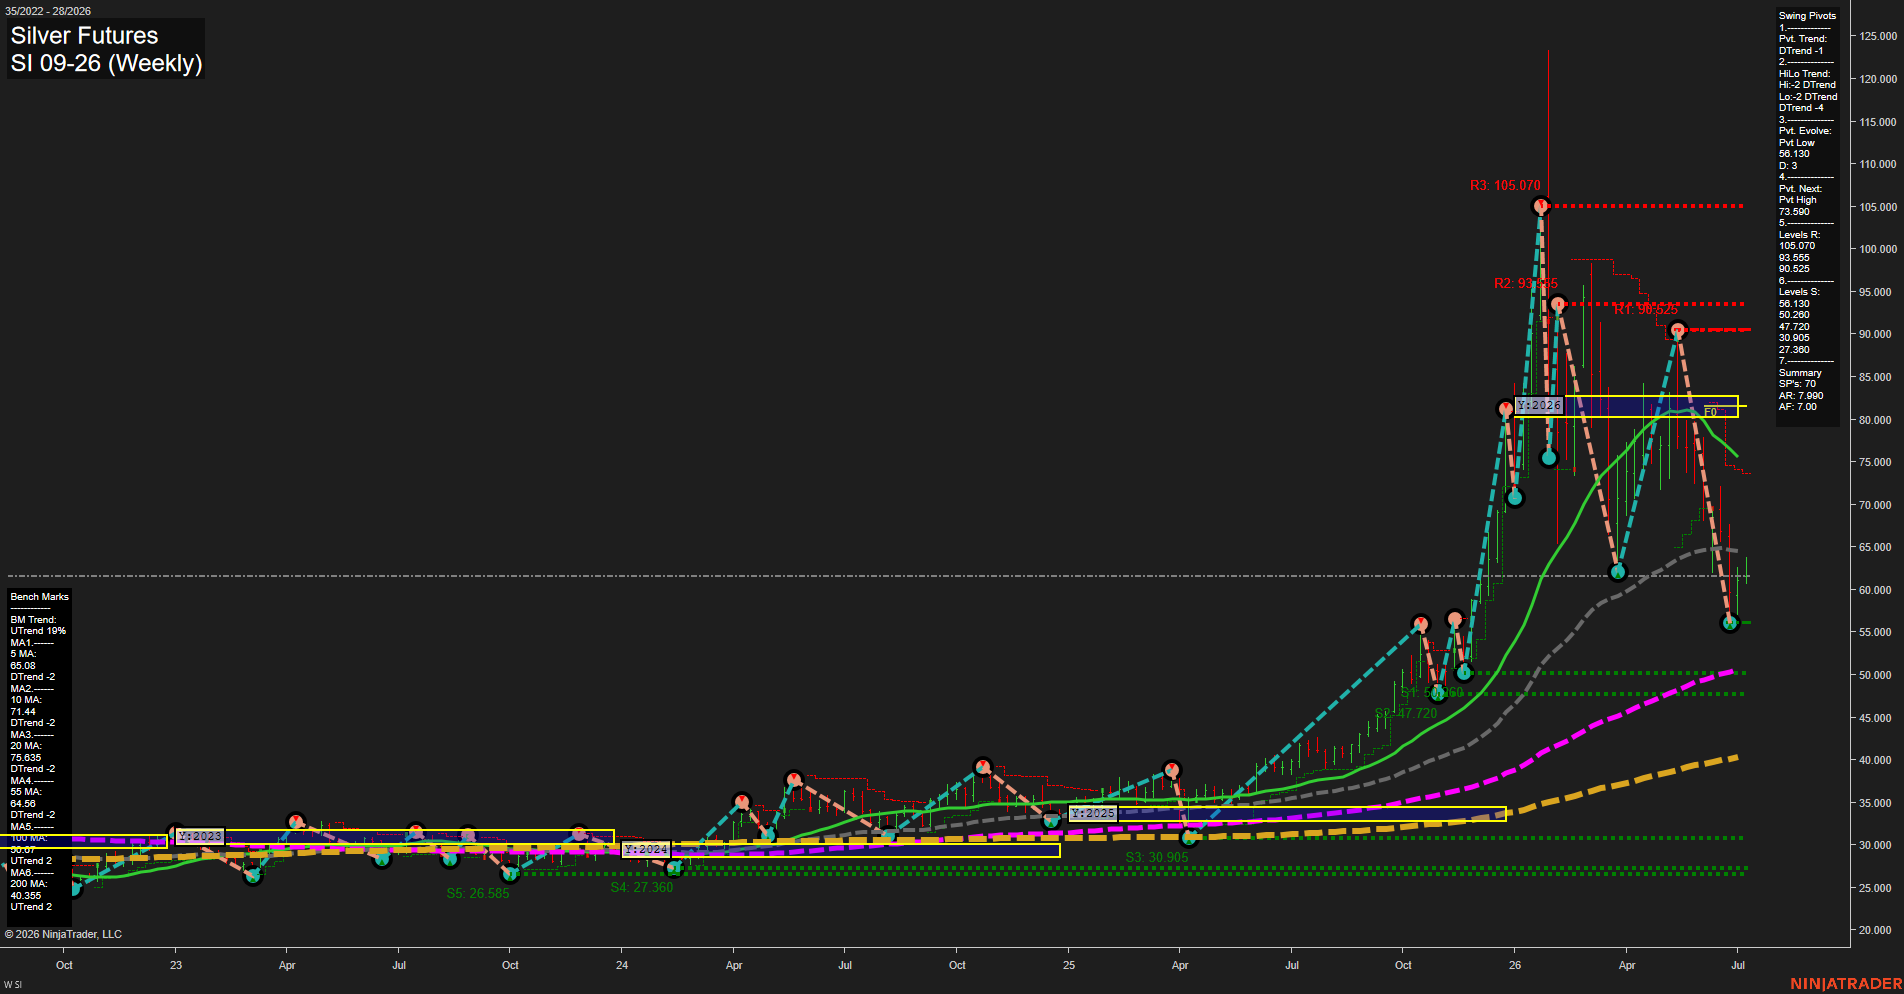
SI Silver Futures Weekly Chart Analysis: 2026-Jul-07 07:07 CT
Price Action
- Last: 62.30,
- Bars: Large,
- Mom: average.
WSFG Weekly
- Short-Term
- WSFG Current: -13%
- F0%/NTZ' Bias: Price Below,
- WSFG Trend: Down.
MSFG Month Jul
- Intermediate-Term
- MSFG Current: 17%
- F0%/NTZ' Bias: Price Above,
- MSFG Trend: Up.
YSFG Year 2026
- Long-Term
- YSFG Current: -159%
- F0%/NTZ' Bias: Price Below,
- YSFG Trend: Down.
Swing Pivots
- (Short-Term) 1. Pvt. Trend: DTrend,
- (Intermediate-Term) 2. HiLo Trend: DTrend,
- 3. Pvt. Evolve: Pvt Low 56.130,
- 4. Pvt. Next: Pvt High 73.590,
- 5. Levels R: 105.070, 93.555, 90.525,
- 6. Levels S: 56.130, 50.260, 47.720, 30.905, 27.360.
Weekly Benchmarks
- (Short-Term) 5 Day: 65.08 Down Trend,
- (Short-Term) 10 Day: 71.44 Down Trend,
- (Intermediate-Term) 20 Day: 75.635 Down Trend,
- (Intermediate-Term) 55 Day: 64.56 Down Trend,
- (Long-Term) 100 Day: 50.260 Up Trend,
- (Long-Term) 200 Day: 40.355 Up Trend.
Recent Trade Signals
- 07 Jul 2026: Short SI 09-26 @ 61.89 Signals.USAR-WSFG
- 06 Jul 2026: Long SI 09-26 @ 62.805 Signals.USAR-MSFG
- 30 Jun 2026: Long SI 09-26 @ 60.035 Signals.USAR.TR120
Overall Rating
- Short-Term: Bearish,
- Intermediate-Term: Bullish,
- Long-Term: Bearish.
Key Insights Summary
Silver is in a large weekly swing cycle with a sharp rally into the low 90s and 100s followed by an equally sharp reversal back toward the low 60s. The short-term structure is bearish with price back below the weekly NTZ midpoint and the recent pivot sequence turning down from a high pivot toward the next low pivot. The monthly session remains constructive because price is still above the July NTZ bias and the MSFG trend is up, but the yearly framework is still negative, reflecting that the broader 2026 structure remains below the yearly midpoint and well under the prior expansion highs. Weekly benchmarks are split in a way that favors a cooling phase: shorter benchmarks are declining while the longer benchmarks are still rising, showing a pullback within a larger secular uptrend rather than a clean trend failure. The current tape looks like a post-breakout retracement and consolidation after an extended vertical move, with recent signals showing a quick flip from monthly-long to weekly-short as price rotates through the recent pivot bands.
Chart Analysis ATS AI Generated: 2026-07-07 07:07 for Informational use only, not trading advice. Terms and Risk Disclosure Copyright © 2026. Algo Trading Systems LLC.