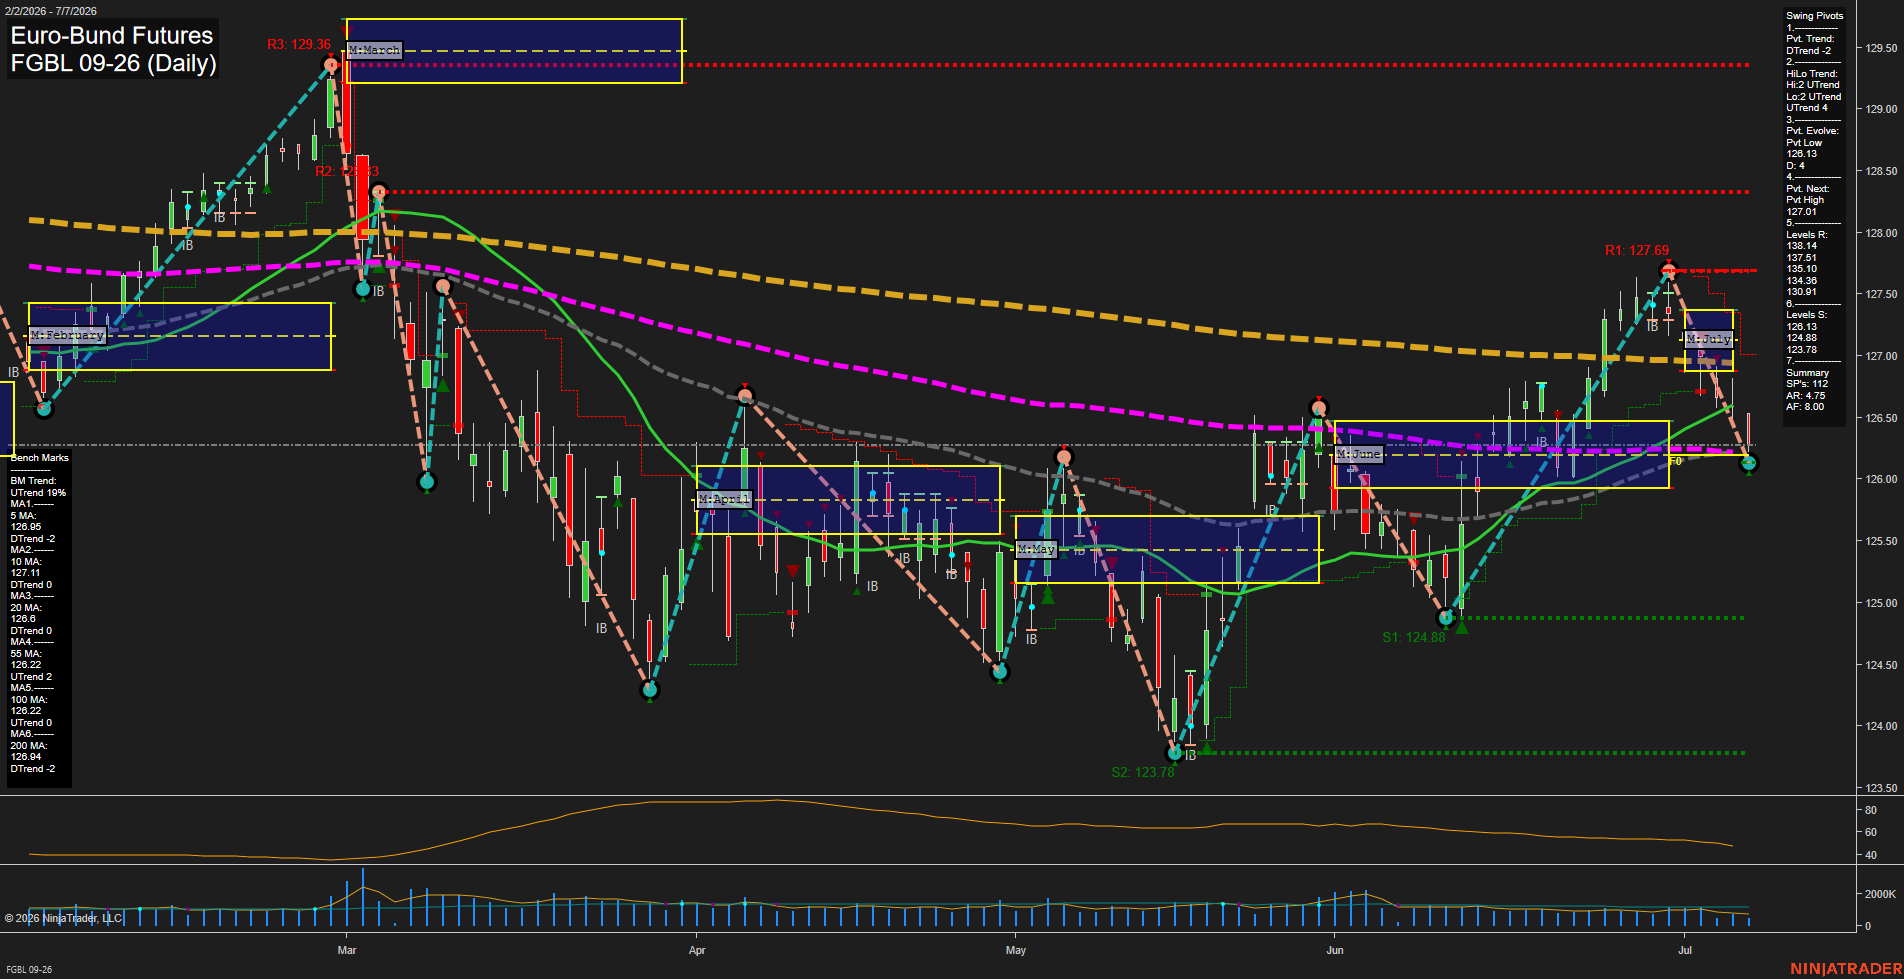
FGBL Euro-Bund Futures Daily Chart Analysis: 2026-Jul-07 07:04 CT
Price Action
- Last: 126.13,
- Bars: Medium,
- Mom: average.
WSFG Weekly
- Short-Term
- WSFG Current: -24%
- F0%/NTZ' Bias: Price Below,
- WSFG Trend: Down.
MSFG Month Jul
- Intermediate-Term
- MSFG Current: -27%
- F0%/NTZ' Bias: Price Below,
- MSFG Trend: Down.
YSFG Year 2026
- Long-Term
- YSFG Current: -3%
- F0%/NTZ' Bias: Price Below,
- YSFG Trend: Down.
Swing Pivots
- (Short-Term) 1. Pvt. Trend: DTrend,
- (Intermediate-Term) 2. HiLo Trend: UTrend,
- 3. Pvt. Evolve: Pvt Low 126.13,
- 4. Pvt. Next: Pvt High 127.01,
- 5. Levels R: 129.36, 128.63, 127.69,
- 6. Levels S: 126.13, 124.88, 123.78.
Daily Benchmarks
- (Short-Term) 5 Day: 126.95 Down Trend,
- (Short-Term) 10 Day: 127.11 Down Trend,
- (Intermediate-Term) 20 Day: 126.60 Down Trend,
- (Intermediate-Term) 55 Day: 126.22 Up Trend,
- (Long-Term) 100 Day: 126.22 Up Trend,
- (Long-Term) 200 Day: 126.94 Down Trend.
Additional Metrics
Recent Trade Signals
- 07 Jul 2026: Short FGBL 09-26 @ 126.37 Signals.USAR-WSFG
- 06 Jul 2026: Short FGBL 09-26 @ 126.5 Signals.USAR.TR720
- 06 Jul 2026: Short FGBL 09-26 @ 126.61 Signals.USAR-MSFG
Overall Rating
- Short-Term: Bearish,
- Intermediate-Term: Bearish,
- Long-Term: Neutral.
Key Insights Summary
Price is pressing back into the lower end of the July NTZ after failing to hold the late-June rally, leaving the daily structure tilted bearish in the near term. The pivot model shows a short-term DTrend with a fresh pivot low at 126.13, while the next opposing pivot high sits at 127.01, framing a tight rebound-versus-retest setup. The benchmark stack is mixed but generally weak on the active swing horizon: the 5, 10, 20, and 200 day averages are aligned negatively, while the 55 and 100 day averages remain firmer and keep the longer backdrop from becoming fully one-sided. The repeated short signals from WSFG, MSFG, and TR720 confirm that the dominant flow has been downside continuation after a sharp June recovery and rejection near 127.69, with higher resistance layered overhead at 128.63 and 129.36. Overall, the chart reads as a bearish retracement inside a broader choppy transition zone, with sellers still controlling the daily swing tone while longer-term structure remains only partially supportive.
Chart Analysis ATS AI Generated: 2026-07-07 07:04 for Informational use only, not trading advice. Terms and Risk Disclosure Copyright © 2026. Algo Trading Systems LLC.