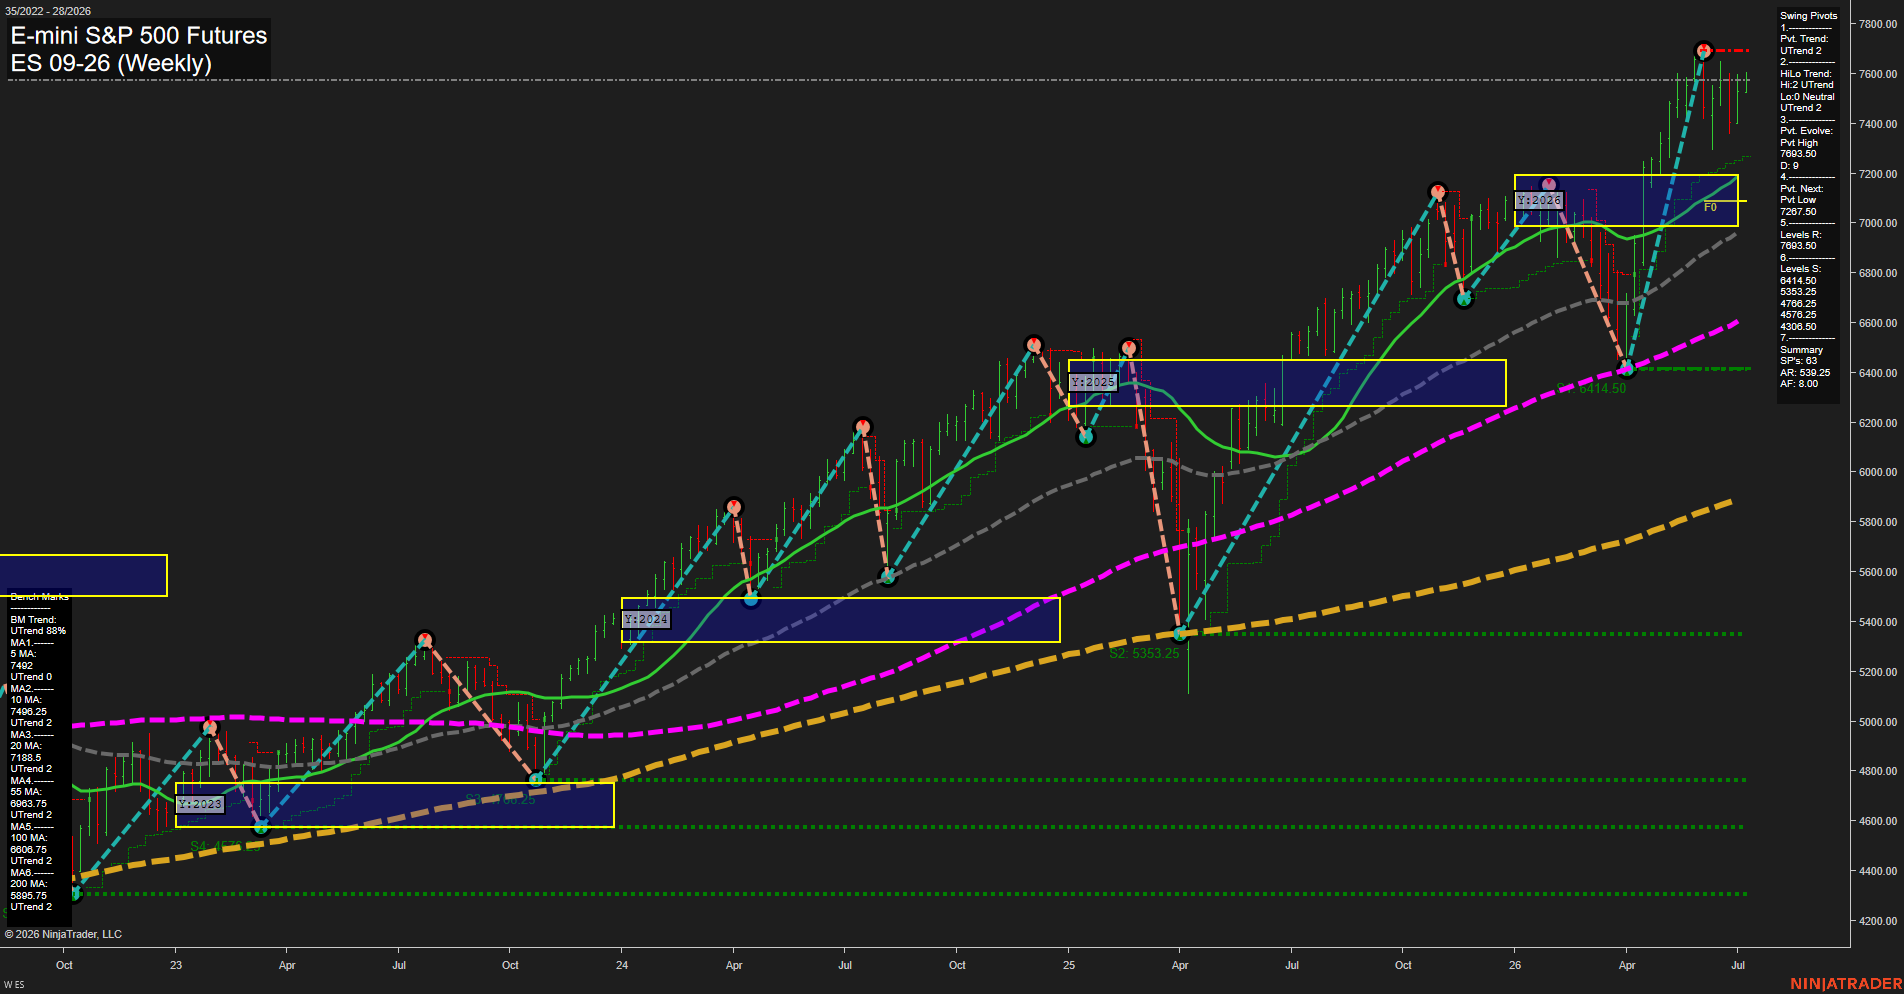
ES E-mini S&P 500 Futures Weekly Chart Analysis: 2026-Jul-07 07:03 CT
Price Action
- Last: 7587.5,
- Bars: Large,
- Mom: fast.
WSFG Weekly
- Short-Term
- WSFG Current: 8%
- F0%/NTZ' Bias: Price Above,
- WSFG Trend: Up.
MSFG Month Jul
- Intermediate-Term
- MSFG Current: 9%
- F0%/NTZ' Bias: Price Above,
- MSFG Trend: Up.
YSFG Year 2026
- Long-Term
- YSFG Current: 47%
- F0%/NTZ' Bias: Price Above,
- YSFG Trend: Up.
Swing Pivots
- (Short-Term) 1. Pvt. Trend: UTrend,
- (Intermediate-Term) 2. HiLo Trend: UTrend,
- 3. Pvt. Evolve: Pvt High 7683.50,
- 4. Pvt. Next: Pvt Low 7267.50,
- 5. Levels R: 7683.50,
- 6. Levels S: 6414.50, 5353.25, 4768.25, 4576.25, 4306.50.
Weekly Benchmarks
- (Short-Term) 5 Day: 7492.00 Up Trend,
- (Short-Term) 10 Day: 7498.25 Up Trend,
- (Intermediate-Term) 20 Day: 7188.50 Up Trend,
- (Intermediate-Term) 55 Day: 6963.75 Up Trend,
- (Long-Term) 100 Day: 6808.75 Up Trend,
- (Long-Term) 200 Day: 5895.75 Up Trend.
Recent Trade Signals
- 06 Jul 2026: Long ES 09-26 @ 7587.5 Signals.USAR-MSFG
- 06 Jul 2026: Long ES 09-26 @ 7587.5 Signals.USAR-WSFG
- 29 Jun 2026: Long ES 09-26 @ 7494 Signals.USAR.TR120
Overall Rating
- Short-Term: Bullish,
- Intermediate-Term: Bullish,
- Long-Term: Bullish.
Key Insights Summary
Price is pressing near fresh cycle highs with a strong weekly upside structure, fast momentum, and candles holding well above the clustered short-term benchmarks. Weekly, monthly, and yearly session fib grids are all aligned above their F0%/NTZ midlines, reinforcing a persistent trend state rather than a mean-reversion phase. The swing pivot structure remains firmly in an uptrend, with the latest pivot high marked at 7683.50 and the next downside pivot reference at 7267.50, showing that price is operating in an elevated breakout range after a sharp advance and rebound. All major moving averages from the 5-day through 200-day are trending higher and stacked in bullish order, which supports a broad trend continuation backdrop. The recent trade signals also reflect synchronized long bias across weekly, monthly, and short-term trend systems.
Chart Analysis ATS AI Generated: 2026-07-07 07:03 for Informational use only, not trading advice. Terms and Risk Disclosure Copyright © 2026. Algo Trading Systems LLC.