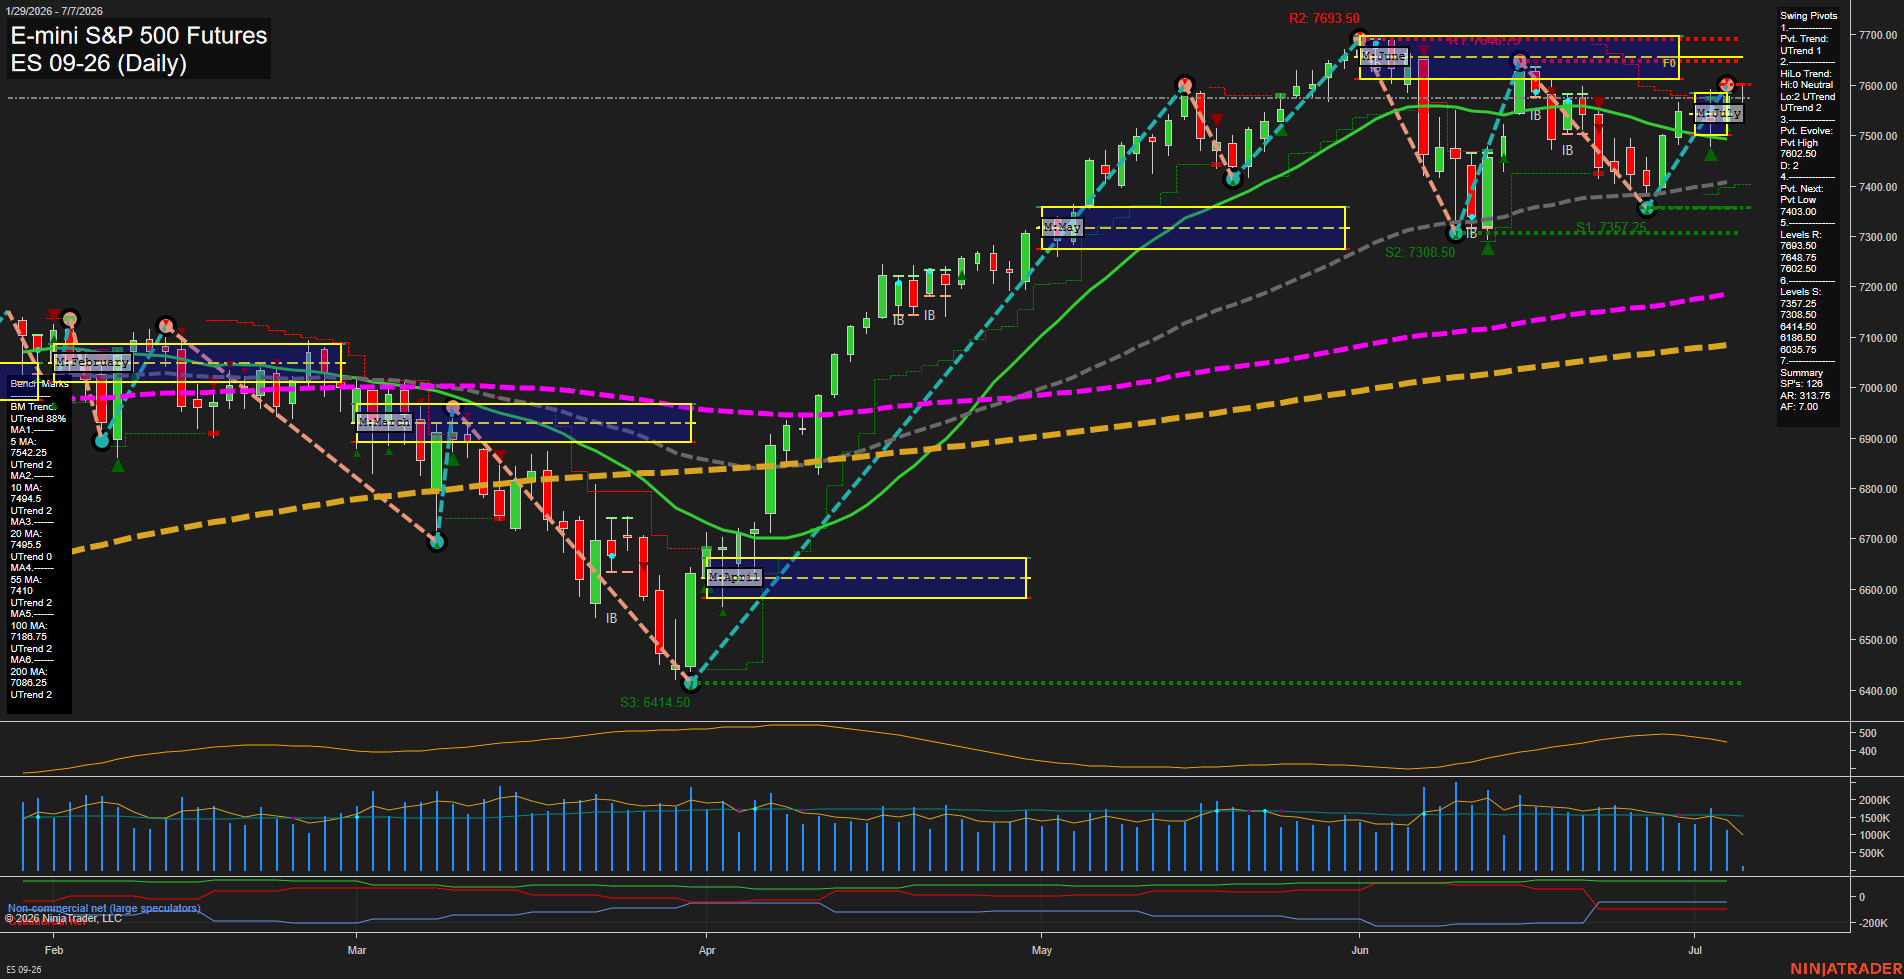
ES E-mini S&P 500 Futures Daily Chart Analysis: 2026-Jul-07 07:03 CT
Price Action
- Last: 7547.50,
- Bars: Medium,
- Mom: average.
WSFG Weekly
- Short-Term
- WSFG Current: 8%
- F0%/NTZ' Bias: Price Above,
- WSFG Trend: Up.
MSFG Month Jul
- Intermediate-Term
- MSFG Current: 9%
- F0%/NTZ' Bias: Price Above,
- MSFG Trend: Up.
YSFG Year 2026
- Long-Term
- YSFG Current: 47%
- F0%/NTZ' Bias: Price Above,
- YSFG Trend: Up.
Swing Pivots
- (Short-Term) 1. Pvt. Trend: UTrend,
- (Intermediate-Term) 2. HiLo Trend: UTrend,
- 3. Pvt. Evolve: Pvt High 7802.50,
- 4. Pvt. Next: Pvt Low 7403.00,
- 5. Levels R: 7693.50, 7648.75, 7602.50,
- 6. Levels S: 7357.25, 7308.50, 6414.50.
Daily Benchmarks
- (Short-Term) 5 Day: 7542.25 Up Trend,
- (Short-Term) 10 Day: 7494.50 Up Trend,
- (Intermediate-Term) 20 Day: 7485.50 Up Trend,
- (Intermediate-Term) 55 Day: 7410.00 Up Trend,
- (Long-Term) 100 Day: 7186.75 Up Trend,
- (Long-Term) 200 Day: 7086.25 Up Trend.
Additional Metrics
- ATR: 319,
- VOLMA: 1611996.
Recent Trade Signals
- 06 Jul 2026: Long ES 09-26 @ 7587.5 Signals.USAR-MSFG
- 06 Jul 2026: Long ES 09-26 @ 7587.5 Signals.USAR-WSFG
- 29 Jun 2026: Long ES 09-26 @ 7494 Signals.USAR.TR120
Overall Rating
- Short-Term: Bullish,
- Intermediate-Term: Bullish,
- Long-Term: Bullish.
Key Insights Summary
Price remains above the weekly, monthly, and yearly F0%/NTZ reference zones, keeping the broader structure in a constructive uptrend. The daily chart shows a strong advance from the April swing low into the June peak, followed by a two-sided consolidation and pullback that is now working back toward the upper benchmark cluster. All benchmark moving averages are aligned in upward trend order, with price holding above the 5, 10, 20, 55, 100, and 200 day measures, which reinforces trend continuity. Swing pivot structure is still upward on both the short-term and intermediate-term readings, while the current pivot map shows a prior high at 7802.50 and a lower reference pivot at 7403.00, framing the present range as a digestion phase inside a larger bullish cycle. Recent signals on the weekly and monthly session fib grids align with the trend and reflect continued upside acceptance after the June pullback. The overall tape looks like a trend-led market with periodic inside bars, retracements, and rejection tests around prior highs and session zones, while the long-term structure stays firmly higher low, higher high.
Chart Analysis ATS AI Generated: 2026-07-07 07:03 for Informational use only, not trading advice. Terms and Risk Disclosure Copyright © 2026. Algo Trading Systems LLC.