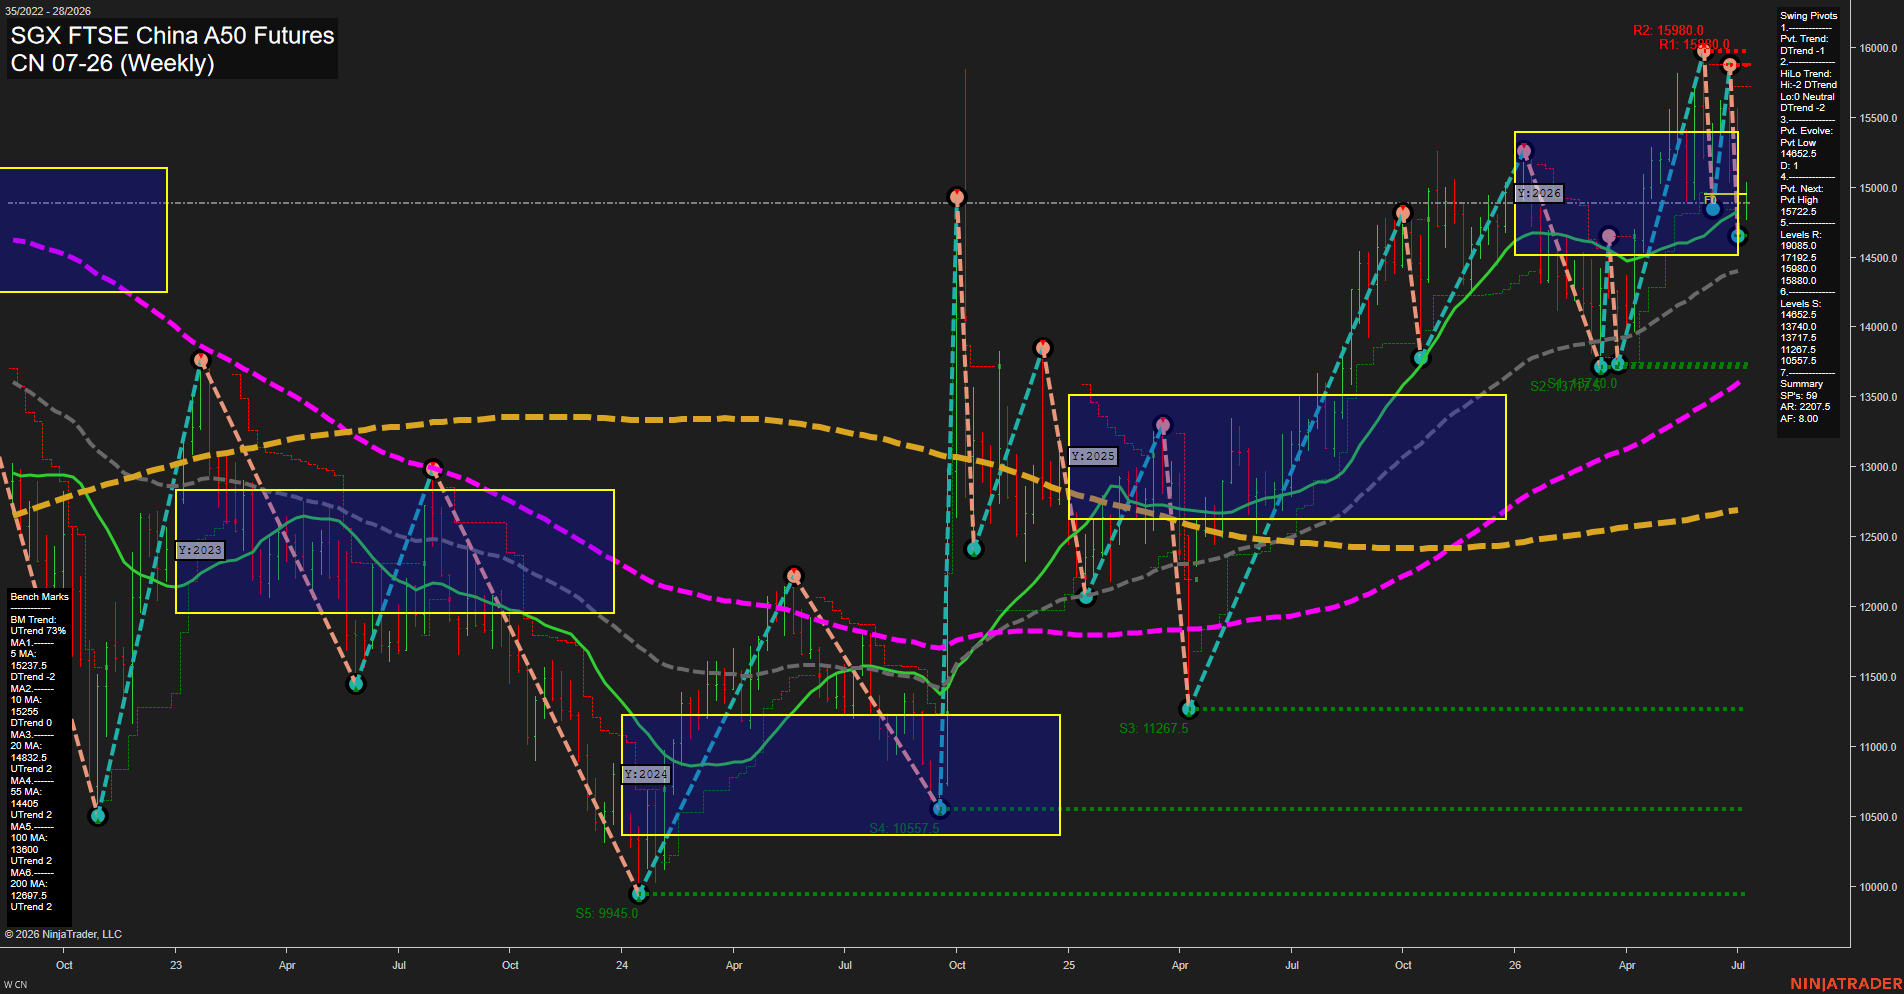
CN SGX FTSE China A50 Futures Weekly Chart Analysis: 2026-Jul-07 07:02 CT
Price Action
- Last: 14700.0,
- Bars: Large,
- Mom: fast.
WSFG Weekly
- Short-Term
- WSFG Current: NA%
- F0%/NTZ' Bias: Price Neutral,
- WSFG Trend: Neutral.
MSFG Month Jul
- Intermediate-Term
- MSFG Current: NA%
- F0%/NTZ' Bias: Price Neutral,
- MSFG Trend: Neutral.
YSFG Year 2026
- Long-Term
- YSFG Current: NA%
- F0%/NTZ' Bias: Price Neutral,
- YSFG Trend: Neutral.
Swing Pivots
- (Short-Term) 1. Pvt. Trend: DTrend,
- (Intermediate-Term) 2. HiLo Trend: DTrend,
- 3. Pvt. Evolve: Pvt Low 14652.5,
- 4. Pvt. Next: Pvt High 15722.5,
- 5. Levels R: 19085.0, 17925.0, 15980.0, 15880.0,
- 6. Levels S: 14652.5, 13740.0, 13117.5, 11287.5, 10557.5.
Weekly Benchmarks
- (Short-Term) 5 Day: 15237.5 Down Trend,
- (Short-Term) 10 Day: 15225.0 Down Trend,
- (Intermediate-Term) 20 Day: 14832.5 Down Trend,
- (Intermediate-Term) 55 Day: 14405.0 Up Trend,
- (Long-Term) 100 Day: 13600.0 Up Trend,
- (Long-Term) 200 Day: 12807.5 Up Trend.
Overall Rating
- Short-Term: Bearish,
- Intermediate-Term: Bullish,
- Long-Term: Bullish.
Key Insights Summary
The weekly structure remains in a larger uptrend but the most recent swing has rolled over into a short-term corrective phase. Price is sitting below the 5, 10, and 20 week benchmarks while still holding above the 55, 100, and 200 week averages, which keeps the broader trend constructive even as near-term momentum softens. The swing pivot sequence is in a DTrend state with the latest pivot low confirmed at 14652.5 and the next opposite pivot level marked higher at 15722.5, showing a pullback inside a broader advancing cycle rather than a major trend break. The pivot resistance stack above price is layered around 15880.0, 15980.0, then 17925.0 and 19085.0, while support is clustered at 14652.5, 13740.0, 13117.5, 11287.5, and 10557.5. From a futures swing trader perspective, the chart shows an impulsive advance into 2026 followed by a sharp rejection from the upper range and a transition into consolidation near the upper-middle of the yearly structure.
Chart Analysis ATS AI Generated: 2026-07-07 07:02 for Informational use only, not trading advice. Terms and Risk Disclosure Copyright © 2026. Algo Trading Systems LLC.