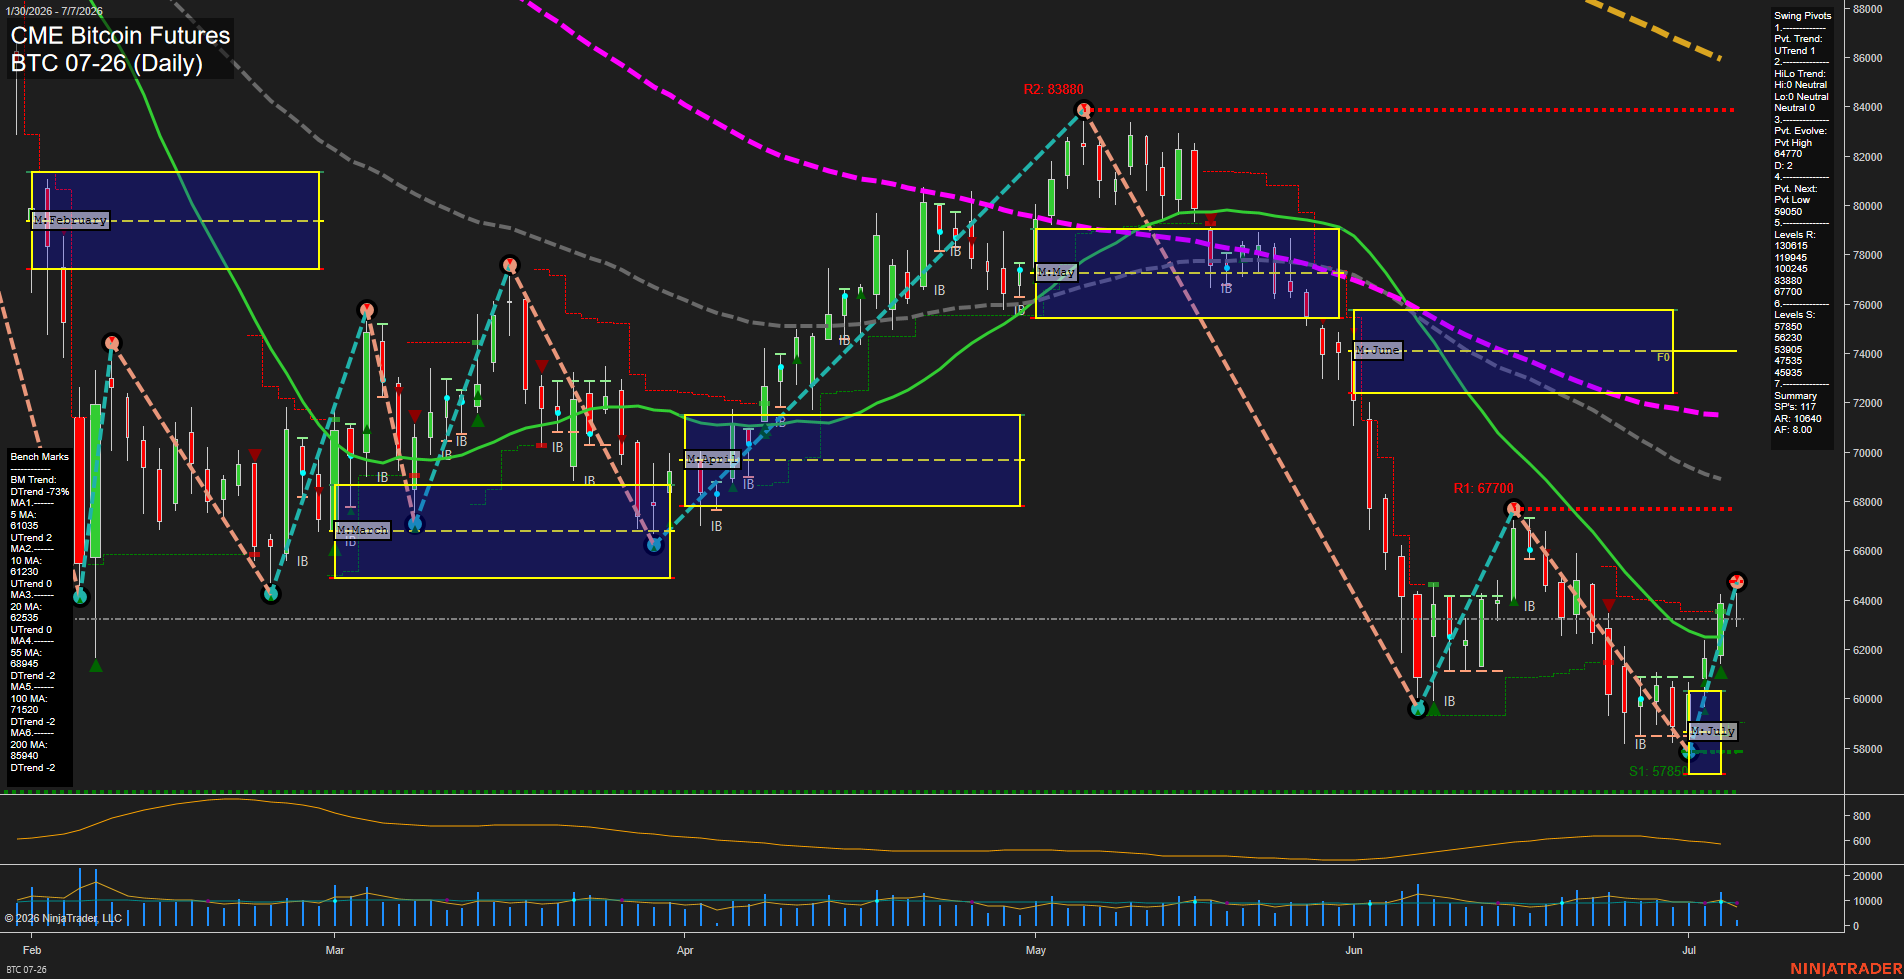
BTC CME Bitcoin Futures Daily Chart Analysis: 2026-Jul-07 07:01 CT
Price Action
- Last: 64000,
- Bars: Large,
- Mom: fast.
WSFG Weekly
- Short-Term
- WSFG Current: 8%
- F0%/NTZ' Bias: Price Above,
- WSFG Trend: Up.
MSFG Month Jul
- Intermediate-Term
- MSFG Current: 32%
- F0%/NTZ' Bias: Price Above,
- MSFG Trend: Up.
YSFG Year 2026
- Long-Term
- YSFG Current: -93%
- F0%/NTZ' Bias: Price Below,
- YSFG Trend: Down.
Swing Pivots
- (Short-Term) 1. Pvt. Trend: UTrend,
- (Intermediate-Term) 2. HiLo Trend: UTrend,
- 3. Pvt. Evolve: Pvt High 64770,
- 4. Pvt. Next: Pvt Low 59050,
- 5. Levels R: 130815, 119945, 100245, 83880, 67700,
- 6. Levels S: 57850, 56230, 53905, 47535, 45935.
Daily Benchmarks
- (Short-Term) 5 Day: 61035 Up Trend,
- (Short-Term) 10 Day: 61230 Up Trend,
- (Intermediate-Term) 20 Day: 62535 Up Trend,
- (Intermediate-Term) 55 Day: 68945 Down Trend,
- (Long-Term) 100 Day: 71520 Down Trend,
- (Long-Term) 200 Day: 85940 Down Trend.
Additional Metrics
Recent Trade Signals
- 06 Jul 2026: Long BTC 07-26 @ 63905 Signals.USAR.TR120
- 06 Jul 2026: Long BTC 07-26 @ 63950 Signals.USAR-WSFG
- 02 Jul 2026: Long BTC 07-26 @ 61265 Signals.USAR-MSFG
Overall Rating
- Short-Term: Bullish,
- Intermediate-Term: Bullish,
- Long-Term: Bearish.
Key Insights Summary
Price is responding with a strong rebound off the early-July low near 57850, reclaiming the 5-day and 10-day benchmarks while holding above the weekly and monthly session fib biases. The swing pivot structure remains in an upward short-term evolution, with the last confirmed pivot high at 64770 and the next pivot low reference at 59050 defining the active swing frame. Intermediate trend tone is constructive because price is back above the 20-day benchmark and inside the monthly NTZ upper region, but the broader daily structure still sits under the 55-day, 100-day, and 200-day benchmarks, leaving the long-term backdrop bearish. The tape shows a sharp countertrend recovery from a deep June selloff, with volatility elevated and momentum currently fast, while the larger yearly session remains well below its F0% center, reflecting a bearish higher-timeframe cycle despite the short-term bounce.
Chart Analysis ATS AI Generated: 2026-07-07 07:01 for Informational use only, not trading advice. Terms and Risk Disclosure Copyright © 2026. Algo Trading Systems LLC.