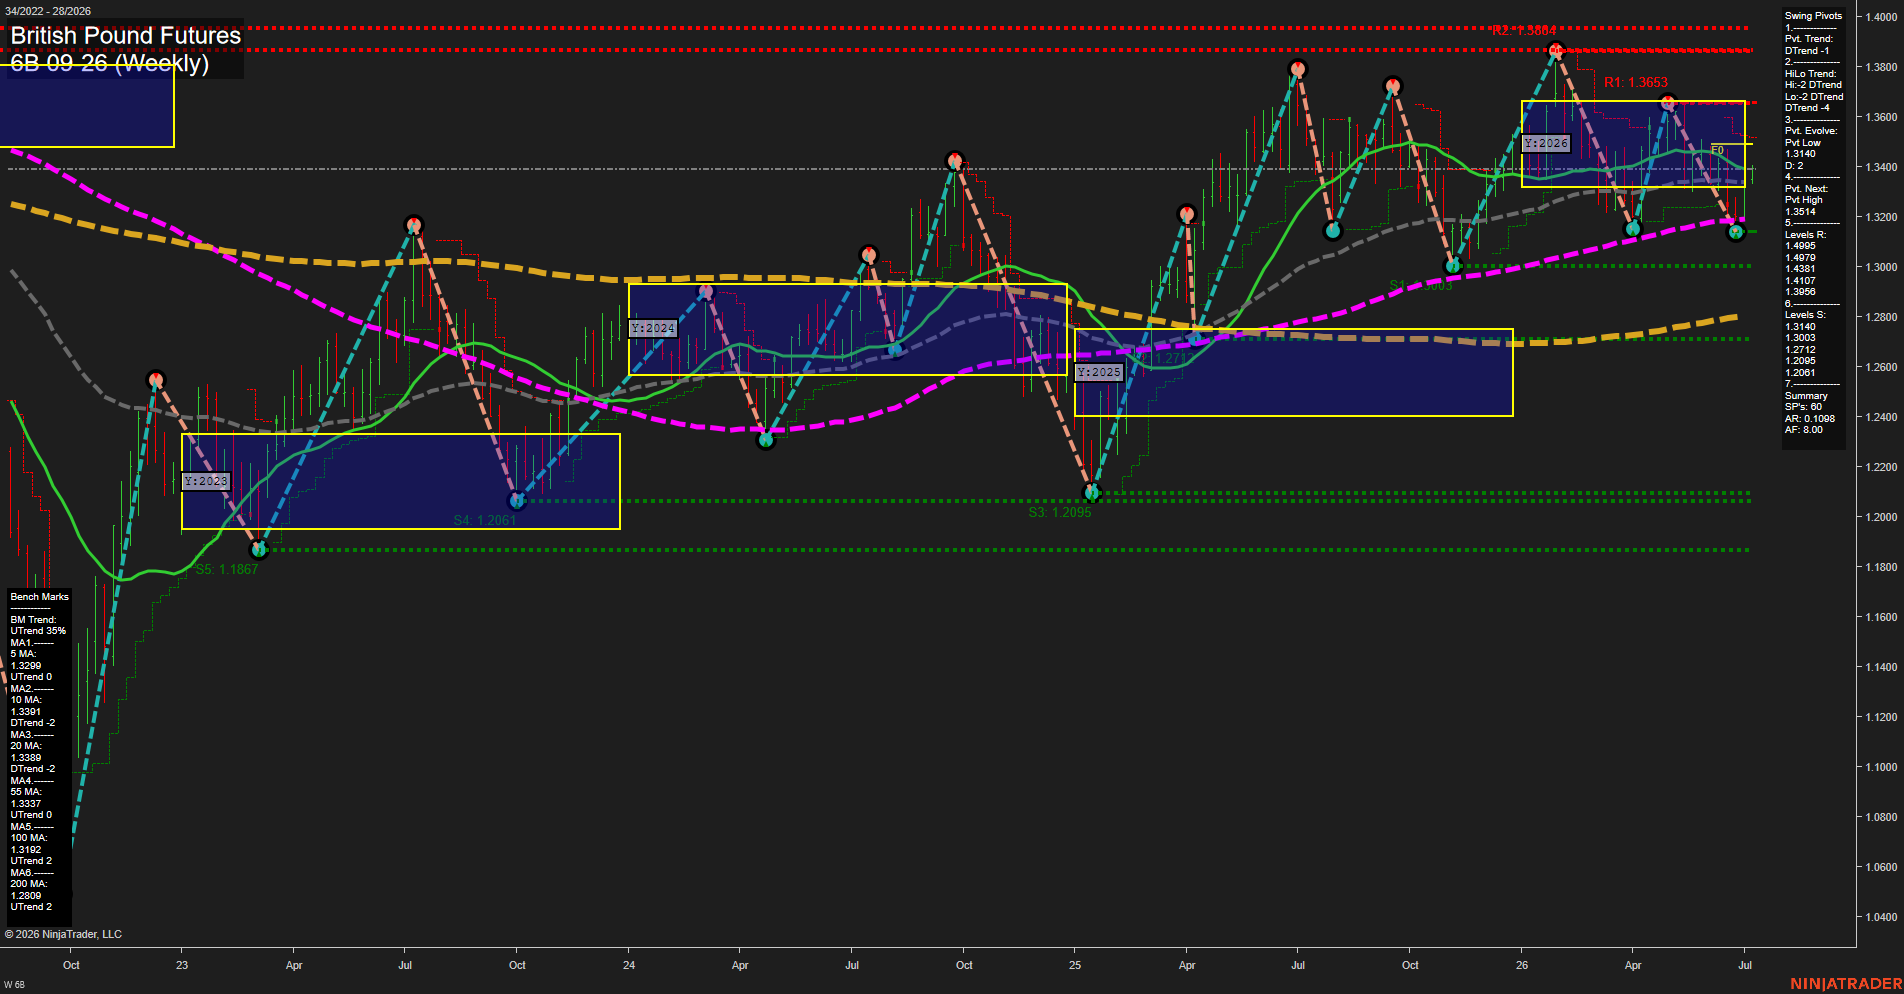
6B British Pound Futures Weekly Chart Analysis: 2026-Jul-07 07:00 CT
Price Action
- Last: 1.3140,
- Bars: Medium,
- Mom: slow.
WSFG Weekly
- Short-Term
- WSFG Current: 18%
- F0%/NTZ' Bias: Price Above,
- WSFG Trend: Up.
MSFG Month Jul
- Intermediate-Term
- MSFG Current: 42%
- F0%/NTZ' Bias: Price Above,
- MSFG Trend: Up.
YSFG Year 2026
- Long-Term
- YSFG Current: -6%
- F0%/NTZ' Bias: Price Below,
- YSFG Trend: Down.
Swing Pivots
- (Short-Term) 1. Pvt. Trend: DTrend,
- (Intermediate-Term) 2. HiLo Trend: DTrend,
- 3. Pvt. Evolve: Pvt Low 1.3140,
- 4. Pvt. Next: Pvt High 1.3514,
- 5. Levels R: 1.4995, 1.4799, 1.4381, 1.4107, 1.3958,
- 6. Levels S: 1.3140, 1.3003, 1.2712, 1.2095, 1.2061.
Weekly Benchmarks
- (Short-Term) 5 Day: 1.3299 Up Trend,
- (Short-Term) 10 Day: 1.3391 Down Trend,
- (Intermediate-Term) 20 Day: 1.3389 Down Trend,
- (Intermediate-Term) 55 Day: 1.3337 Up Trend,
- (Long-Term) 100 Day: 1.3192 Up Trend,
- (Long-Term) 200 Day: 1.2809 Up Trend.
Recent Trade Signals
- 07 Jul 2026: Long 6B 09-26 @ 1.3386 Signals.USAR-WSFG
- 02 Jul 2026: Long 6B 09-26 @ 1.3361 Signals.USAR.TR720
- 02 Jul 2026: Long 6B 09-26 @ 1.3291 Signals.USAR-MSFG
Overall Rating
- Short-Term: Neutral,
- Intermediate-Term: Bullish,
- Long-Term: Neutral.
Key Insights Summary
The weekly structure shows British Pound Futures holding a broad recovery pattern after a deep 2025 selloff, with price currently pressing around the 1.3140 pivot low area while still sitting above the yearly fib midpoint zone bias. Short-term swing pivots remain in a DTrend, reflecting a recent corrective pullback from the spring rally highs, but the monthly session fib grid remains constructive and the latest long signals show continued participation on the upside. The benchmark stack is mixed near the front end, with 5-day support still above price relationship while the 10-day and 20-day averages lean lower, yet the 55-day, 100-day, and 200-day benchmarks remain in up-trend alignment, supporting a higher-level bullish backdrop. From a swing trader perspective, the chart is in a consolidation/pullback phase beneath recent highs, with the larger 2026 range still defined by repeated tests and reactions between the 1.30 area and the 1.35/1.36 zone.
Chart Analysis ATS AI Generated: 2026-07-07 07:00 for Informational use only, not trading advice. Terms and Risk Disclosure Copyright © 2026. Algo Trading Systems LLC.