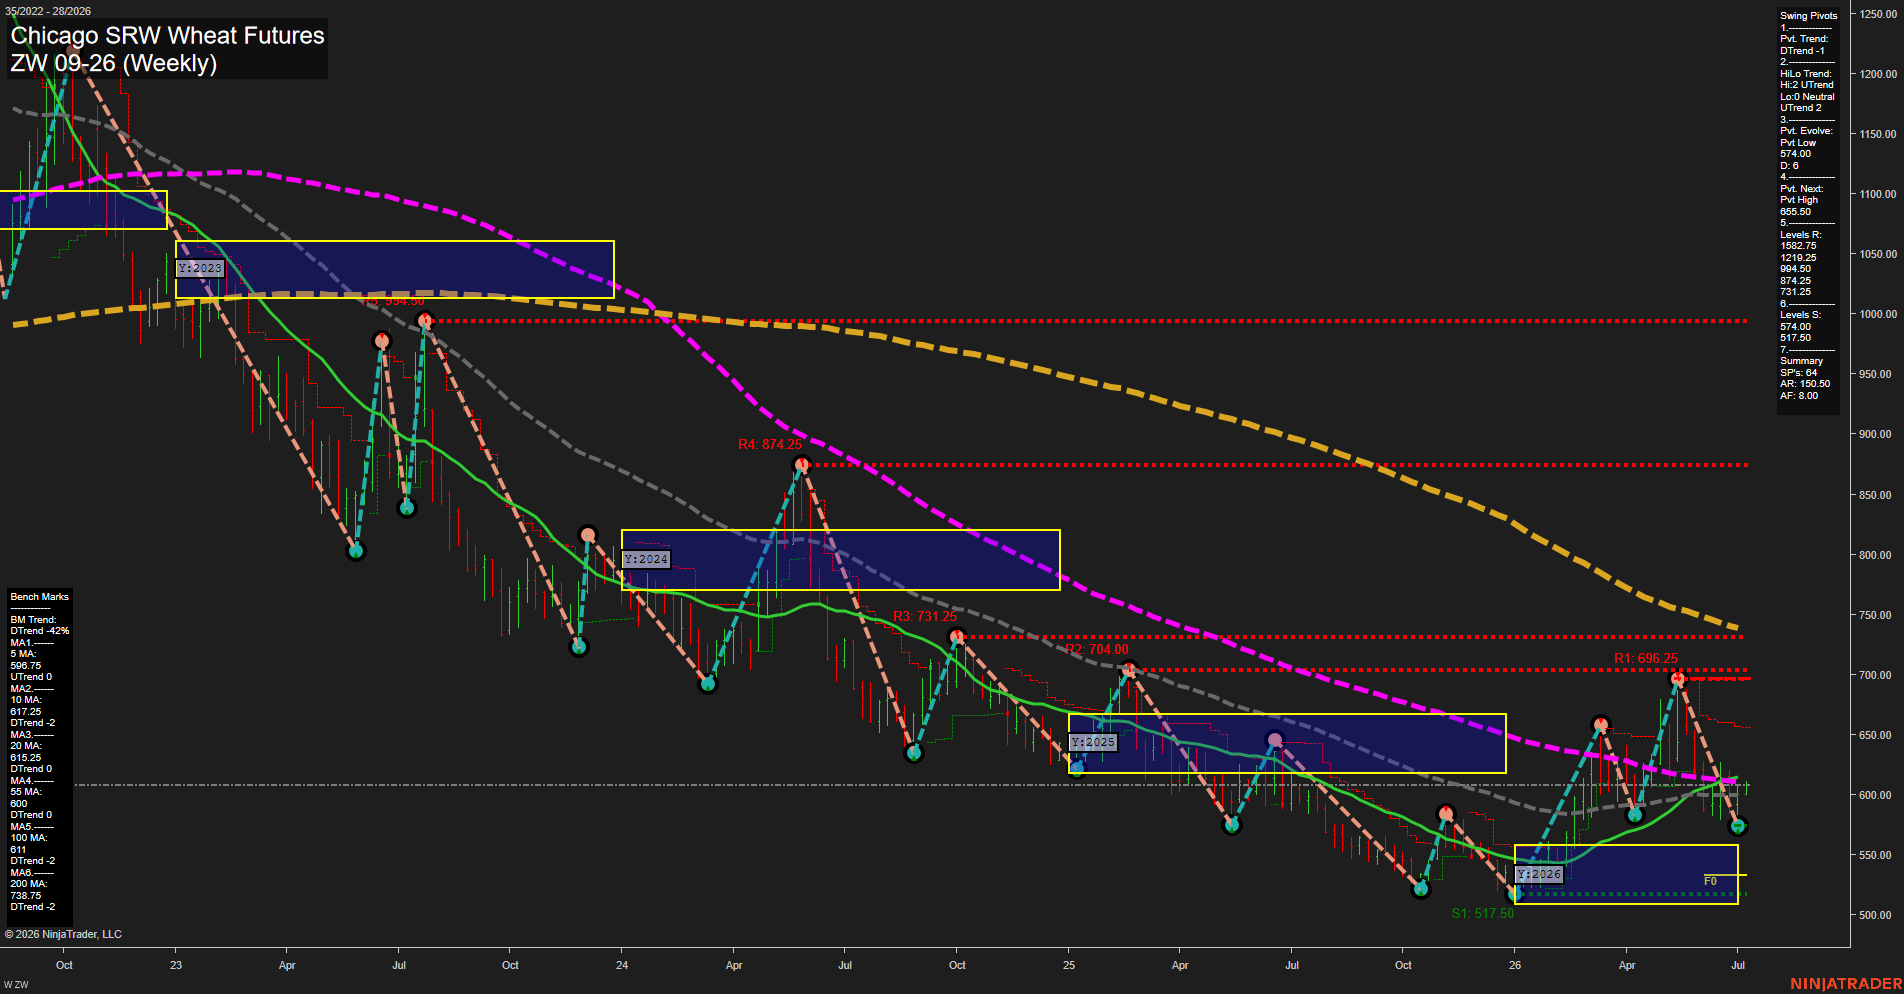
ZW Chicago SRW Wheat Futures Weekly Chart Analysis: 2026-Jul-06 07:09 CT
Price Action
- Last: 606.50,
- Bars: Medium,
- Mom: average.
WSFG Weekly
- Short-Term
- WSFG Current: 24%
- F0%/NTZ' Bias: Price Above,
- WSFG Trend: Up.
MSFG Month Jul
- Intermediate-Term
- MSFG Current: 14%
- F0%/NTZ' Bias: Price Above,
- MSFG Trend: Up.
YSFG Year 2026
- Long-Term
- YSFG Current: 31%
- F0%/NTZ' Bias: Price Above,
- YSFG Trend: Up.
Swing Pivots
- (Short-Term) 1. Pvt. Trend: DTrend,
- (Intermediate-Term) 2. HiLo Trend: UTrend,
- 3. Pvt. Evolve: Pvt Low 574.00,
- 4. Pvt. Next: Pvt High 665.50,
- 5. Levels R: 1582.75, 1219.25, 994.50, 874.25, 731.25,
- 6. Levels S: 574.00, 517.50.
Weekly Benchmarks
- (Short-Term) 5 Day: 596.75 Up Trend,
- (Short-Term) 10 Day: 617.25 Down Trend,
- (Intermediate-Term) 20 Day: 615.25 Up Trend,
- (Intermediate-Term) 55 Day: 600.00 Down Trend,
- (Long-Term) 100 Day: 611.00 Down Trend,
- (Long-Term) 200 Day: 738.75 Down Trend.
Recent Trade Signals
- 06 Jul 2026: Long ZW 09-26 @ 606.5 Signals.USAR-MSFG
- 06 Jul 2026: Long ZW 09-26 @ 604.5 Signals.USAR-WSFG
- 01 Jul 2026: Long ZW 09-26 @ 593.5 Signals.USAR.TR120
- 29 Jun 2026: Short ZW 09-26 @ 582.25 Signals.USAR.TR720
Overall Rating
- Short-Term: Bullish,
- Intermediate-Term: Bullish,
- Long-Term: Neutral.
Key Insights Summary
The weekly wheat structure remains in a broad downtrend from the major highs, but price has stabilized well above the 2026 yearly NTZ/F0 zone and is pressing into a short-term recovery phase. The current swing pivot posture is still DTrend on the short side, yet the HiLo trend is UTrend and the recent long signals from WSFG and MSFG confirm a constructive bounce sequence. Price is trading around 606.5 with the 5-day benchmark supportive, while the 10-day and 100-day remain overhead and define the next supply layers. The 20-day benchmark has turned supportive, which fits a rebound that is trying to evolve from counter-trend bounce into a more durable weekly rally. The pivot map shows a nearby next upside pivot around 665.50, with support anchored at 574.00 and then 517.50, keeping the market in a recovery corridor between mid-500s support and mid-660s resistance. Overall, the chart reflects a market that is still long-term heavy but improving on the weekly and monthly swing frames, with price holding above the yearly midpoint and attempting to build higher lows after the late-June pullback.
Chart Analysis ATS AI Generated: 2026-07-06 07:09 for Informational use only, not trading advice. Terms and Risk Disclosure Copyright © 2026. Algo Trading Systems LLC.