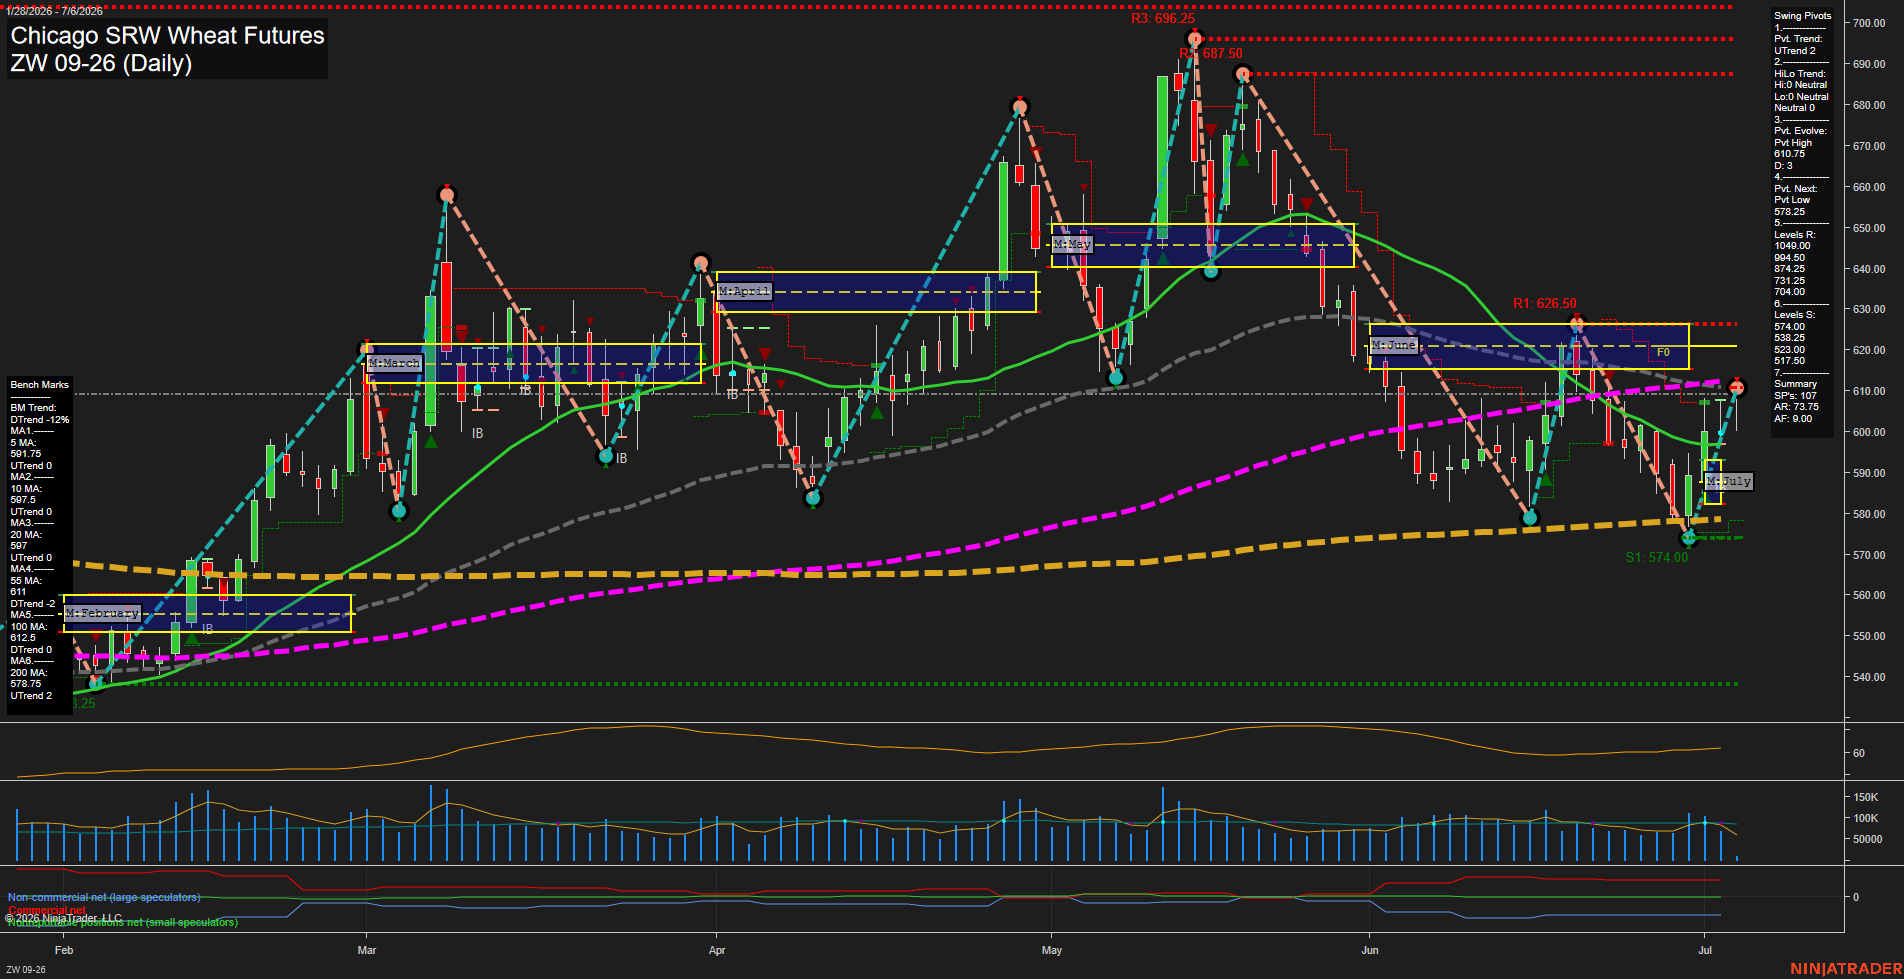
ZW Chicago SRW Wheat Futures Daily Chart Analysis: 2026-Jul-06 07:09 CT
Price Action
- Last: 609.75,
- Bars: Medium,
- Mom: average.
WSFG Weekly
- Short-Term
- WSFG Current: 24%
- F0%/NTZ' Bias: Price Above,
- WSFG Trend: Up.
MSFG Month Jul
- Intermediate-Term
- MSFG Current: 14%
- F0%/NTZ' Bias: Price Above,
- MSFG Trend: Up.
YSFG Year 2026
- Long-Term
- YSFG Current: 31%
- F0%/NTZ' Bias: Price Above,
- YSFG Trend: Up.
Swing Pivots
- (Short-Term) 1. Pvt. Trend: UTrend,
- (Intermediate-Term) 2. HiLo Trend: UTrend,
- 3. Pvt. Evolve: Pvt High 610.75,
- 4. Pvt. Next: Pvt Low 578.25,
- 5. Levels R: 1049.00, 994.50, 874.25, 731.25, 704.00,
- 6. Levels S: 574.00, 538.25, 523.00, 517.50.
Daily Benchmarks
- (Short-Term) 5 Day: 591.75 Up Trend,
- (Short-Term) 10 Day: 597.50 Up Trend,
- (Intermediate-Term) 20 Day: 597.00 Up Trend,
- (Intermediate-Term) 55 Day: 611.00 Down Trend,
- (Long-Term) 100 Day: 612.50 Down Trend,
- (Long-Term) 200 Day: 578.75 Up Trend.
Additional Metrics
Recent Trade Signals
- 06 Jul 2026: Long ZW 09-26 @ 606.5 Signals.USAR-MSFG
- 06 Jul 2026: Long ZW 09-26 @ 604.5 Signals.USAR-WSFG
- 01 Jul 2026: Long ZW 09-26 @ 593.5 Signals.USAR.TR120
- 29 Jun 2026: Short ZW 09-26 @ 582.25 Signals.USAR.TR720
Overall Rating
- Short-Term: Bullish,
- Intermediate-Term: Neutral,
- Long-Term: Neutral.
Key Insights Summary
Price is trading back above the weekly and monthly session fib grids, with the short-term pivot structure still pointing higher after the recent rebound from the late-June low area. The last swing high at 610.75 is being tested from below, while the next lower pivot reference sits at 578.25, showing a broad range but with improving near-term structure. Daily benchmarks are mixed: the 5, 10, and 20 day averages are aligned upward, but price is still below the 55 and 100 day averages, which keeps the intermediate picture balanced rather than fully trending. The 200 day remains upward, so the broader backdrop is still constructive even as the chart works through a retracement and recovery phase. Recent long signals on both WSFG and MSFG reinforce the current bounce, while the prior long-term short signal reflects the earlier down-leg within the larger swing cycle.
Chart Analysis ATS AI Generated: 2026-07-06 07:09 for Informational use only, not trading advice. Terms and Risk Disclosure Copyright © 2026. Algo Trading Systems LLC.