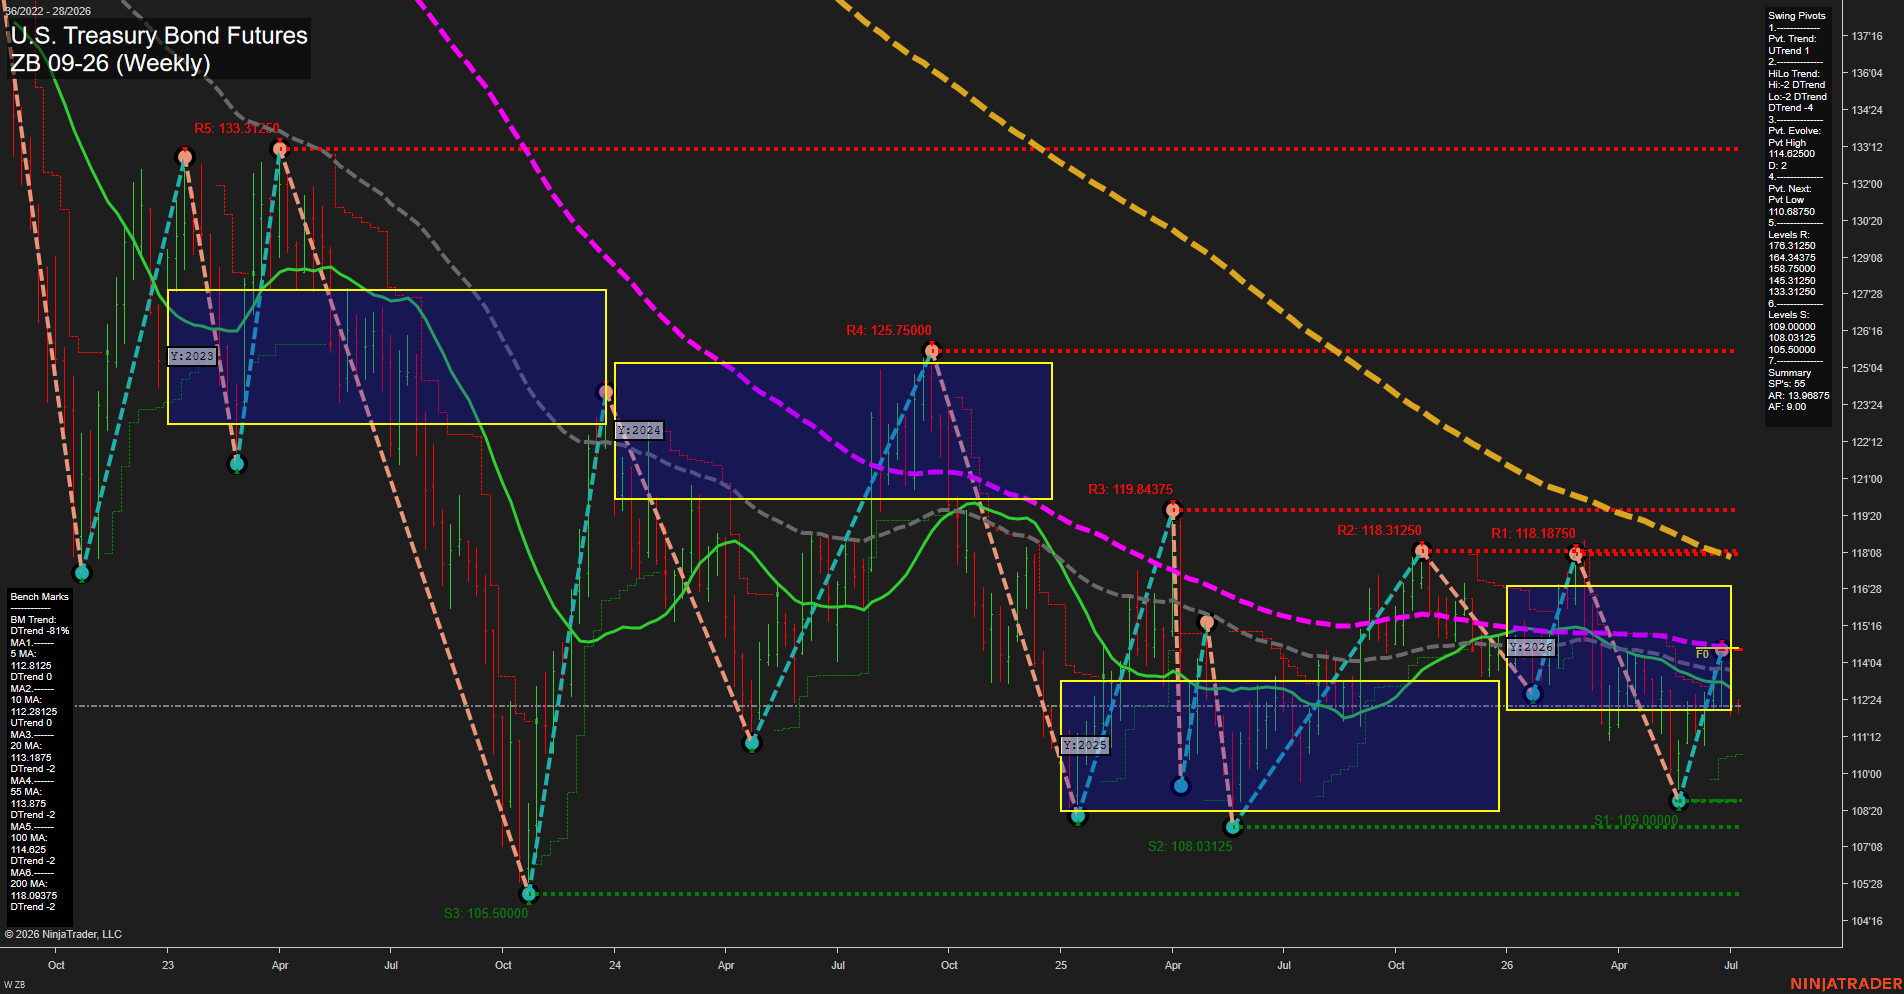
ZB U.S. Treasury Bond Futures Weekly Chart Analysis: 2026-Jul-06 07:08 CT
Price Action
- Last: 114.1250,
- Bars: Medium,
- Mom: average.
WSFG Weekly
- Short-Term
- WSFG Current: NA%
- F0%/NTZ' Bias: Price Neutral,
- WSFG Trend: Neutral.
MSFG Month Jul
- Intermediate-Term
- MSFG Current: NA%
- F0%/NTZ' Bias: Price Neutral,
- MSFG Trend: Neutral.
YSFG Year 2026
- Long-Term
- YSFG Current: NA%
- F0%/NTZ' Bias: Price Neutral,
- YSFG Trend: Neutral.
Swing Pivots
- (Short-Term) 1. Pvt. Trend: UTrend,
- (Intermediate-Term) 2. HiLo Trend: DTrend,
- 3. Pvt. Evolve: Pvt High 114.62500,
- 4. Pvt. Next: Pvt Low 110.68750,
- 5. Levels R: 176.31250, 164.34375, 158.75000, 145.31250, 133.31250,
- 6. Levels S: 109.00000, 108.03125, 105.50000, 7.00000.
Weekly Benchmarks
- (Short-Term) 5 Day: 112.81250 Down Trend,
- (Short-Term) 10 Day: 112.28125 Up Trend,
- (Intermediate-Term) 20 Day: 113.18750 Down Trend,
- (Intermediate-Term) 55 Day: 113.87500 Down Trend,
- (Long-Term) 100 Day: 114.62500 Down Trend,
- (Long-Term) 200 Day: 118.09375 Down Trend.
Overall Rating
- Short-Term: Neutral,
- Intermediate-Term: Bearish,
- Long-Term: Bearish.
Key Insights Summary
Weekly ZB is trading inside a broader down-sloping structure, with price recently rebounding from the lower part of the 2026 NTZ and pressing back toward the 114 handle. The short-term pivot sequence is still marked UTrend, but the intermediate HiLo structure remains DTrend, which keeps the larger swing context bearish. Price is sitting below the 20, 55, 100, and 200-week benchmarks, confirming that the dominant trend pressure is still lower despite the latest bounce. The chart shows a choppy, rotational market with repeated rallies failing near prior swing resistance and a series of lower highs and lower lows across the larger cycle. The current move looks more like a counter-trend recovery within a longer corrective decline than a full trend reversal.
Chart Analysis ATS AI Generated: 2026-07-06 07:08 for Informational use only, not trading advice. Terms and Risk Disclosure Copyright © 2026. Algo Trading Systems LLC.