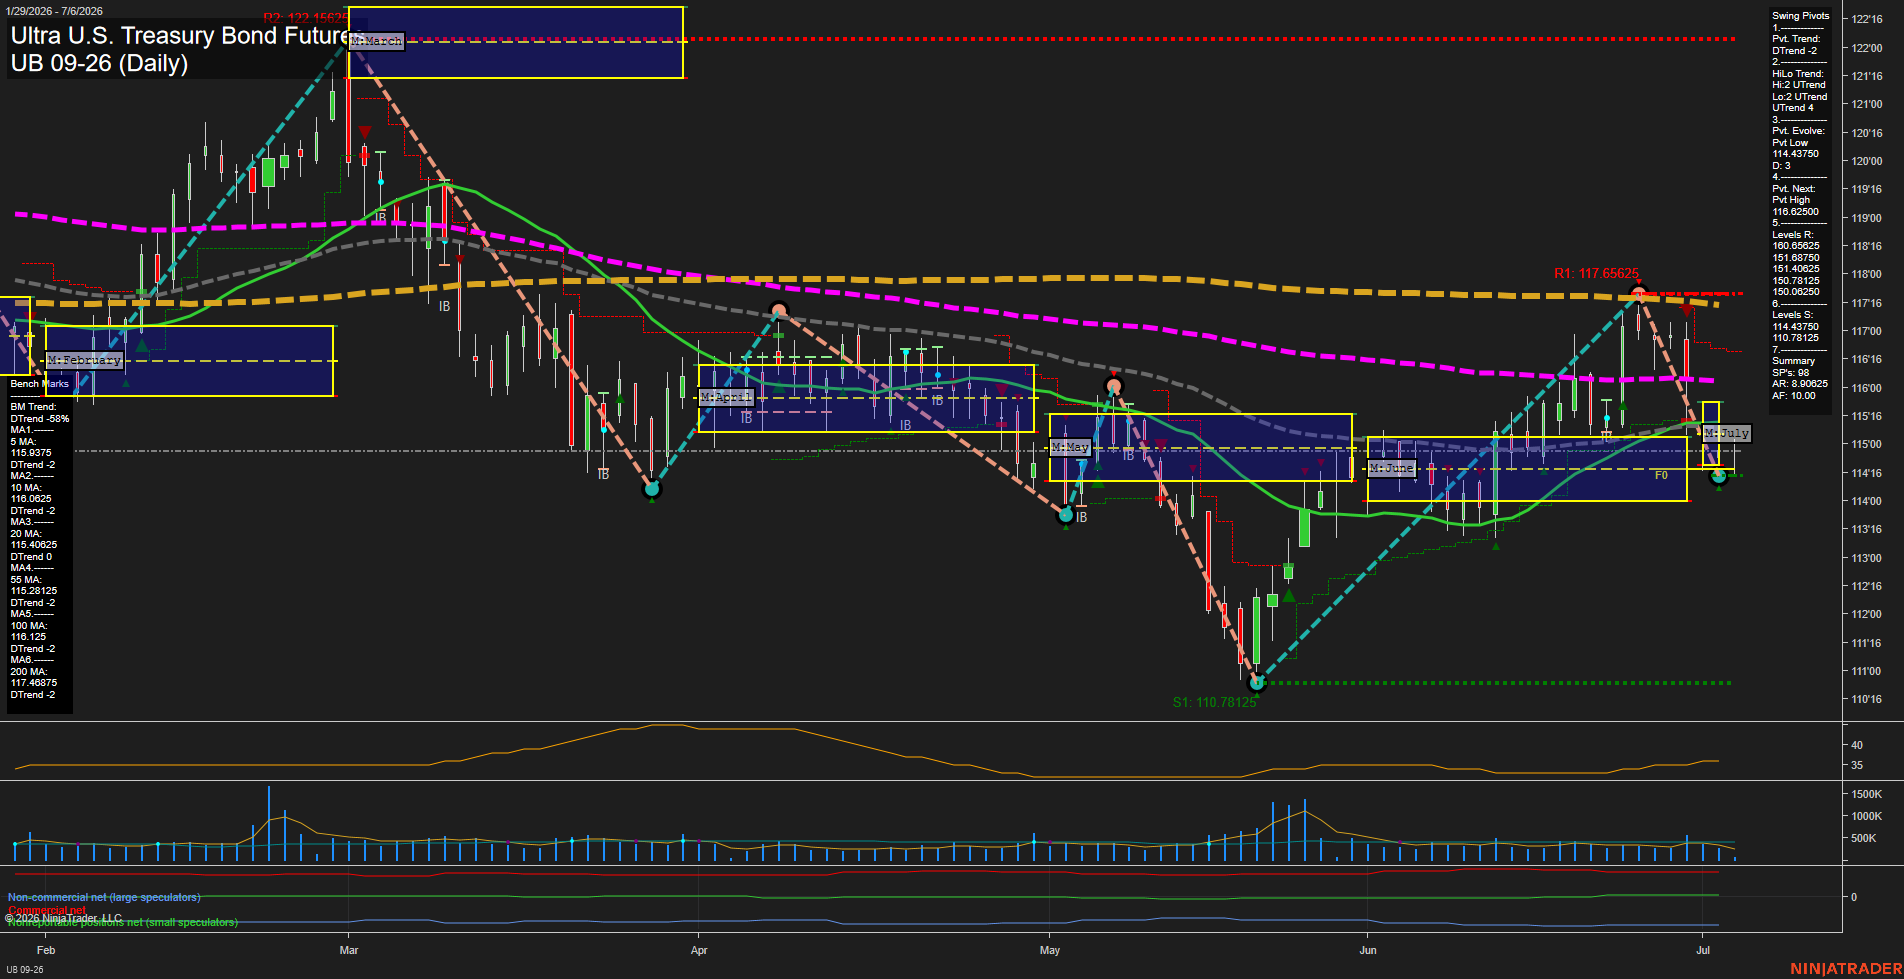
UB Ultra U.S. Treasury Bond Futures Daily Chart Analysis: 2026-Jul-06 07:07 CT
Price Action
- Last: 114'16,
- Bars: Large,
- Mom: Average.
WSFG Weekly
- Short-Term
- WSFG Current: 4%
- F0%/NTZ' Bias: Price Above,
- WSFG Trend: Up.
MSFG Month Jul
- Intermediate-Term
- MSFG Current: -8%
- F0%/NTZ' Bias: Price Below,
- MSFG Trend: Down.
YSFG Year 2026
- Long-Term
- YSFG Current: -8%
- F0%/NTZ' Bias: Price Below,
- YSFG Trend: Down.
Swing Pivots
- (Short-Term) 1. Pvt. Trend: DTrend,
- (Intermediate-Term) 2. HiLo Trend: UTrend,
- 3. Pvt. Evolve: Pvt Low 114.43750,
- 4. Pvt. Next: Pvt High 116.62500,
- 5. Levels R: 122.15625, 117.65625, 116.62500, 116.00000,
- 6. Levels S: 114.43750, 110.78125, 110.00000.
Daily Benchmarks
- (Short-Term) 5 Day: 115.93750 Down Trend,
- (Short-Term) 10 Day: 116.06250 Down Trend,
- (Intermediate-Term) 20 Day: 115.40625 Down Trend,
- (Intermediate-Term) 55 Day: 115.28125 Down Trend,
- (Long-Term) 100 Day: 116.12500 Down Trend,
- (Long-Term) 200 Day: 117.46875 Down Trend.
Additional Metrics
Recent Trade Signals
- 06 Jul 2026: Long UB 09-26 @ 115 Signals.USAR-WSFG
- 06 Jul 2026: Short UB 09-26 @ 114.65625 Signals.USAR-MSFG
- 30 Jun 2026: Short UB 09-26 @ 116.21875 Signals.USAR.TR120
Overall Rating
- Short-Term: Neutral,
- Intermediate-Term: Bearish,
- Long-Term: Bearish.
Key Insights Summary
The daily chart is still working through a broad corrective phase, with price sitting near the lower part of the recent June-to-July range after a sharp rebound from the May swing low. Short-term structure is mixed-to-neutral because the weekly fib grid is positive and price is above the weekly NTZ, but the daily pivot trend remains down and the market is still capped under the cluster of declining benchmark moving averages. Intermediate and long-term structure remain bearish, as price is below the monthly and yearly session fib midlines and the 55/100/200-day benchmarks are all in downtrend alignment. The swing map shows a confirmed low pivot already in place, with the next important upside reference being the prior high pivot area, while recent signals reflect both the short-covering rebound and the larger monthly pressure still in force.
Chart Analysis ATS AI Generated: 2026-07-06 07:07 for Informational use only, not trading advice. Terms and Risk Disclosure Copyright © 2026. Algo Trading Systems LLC.