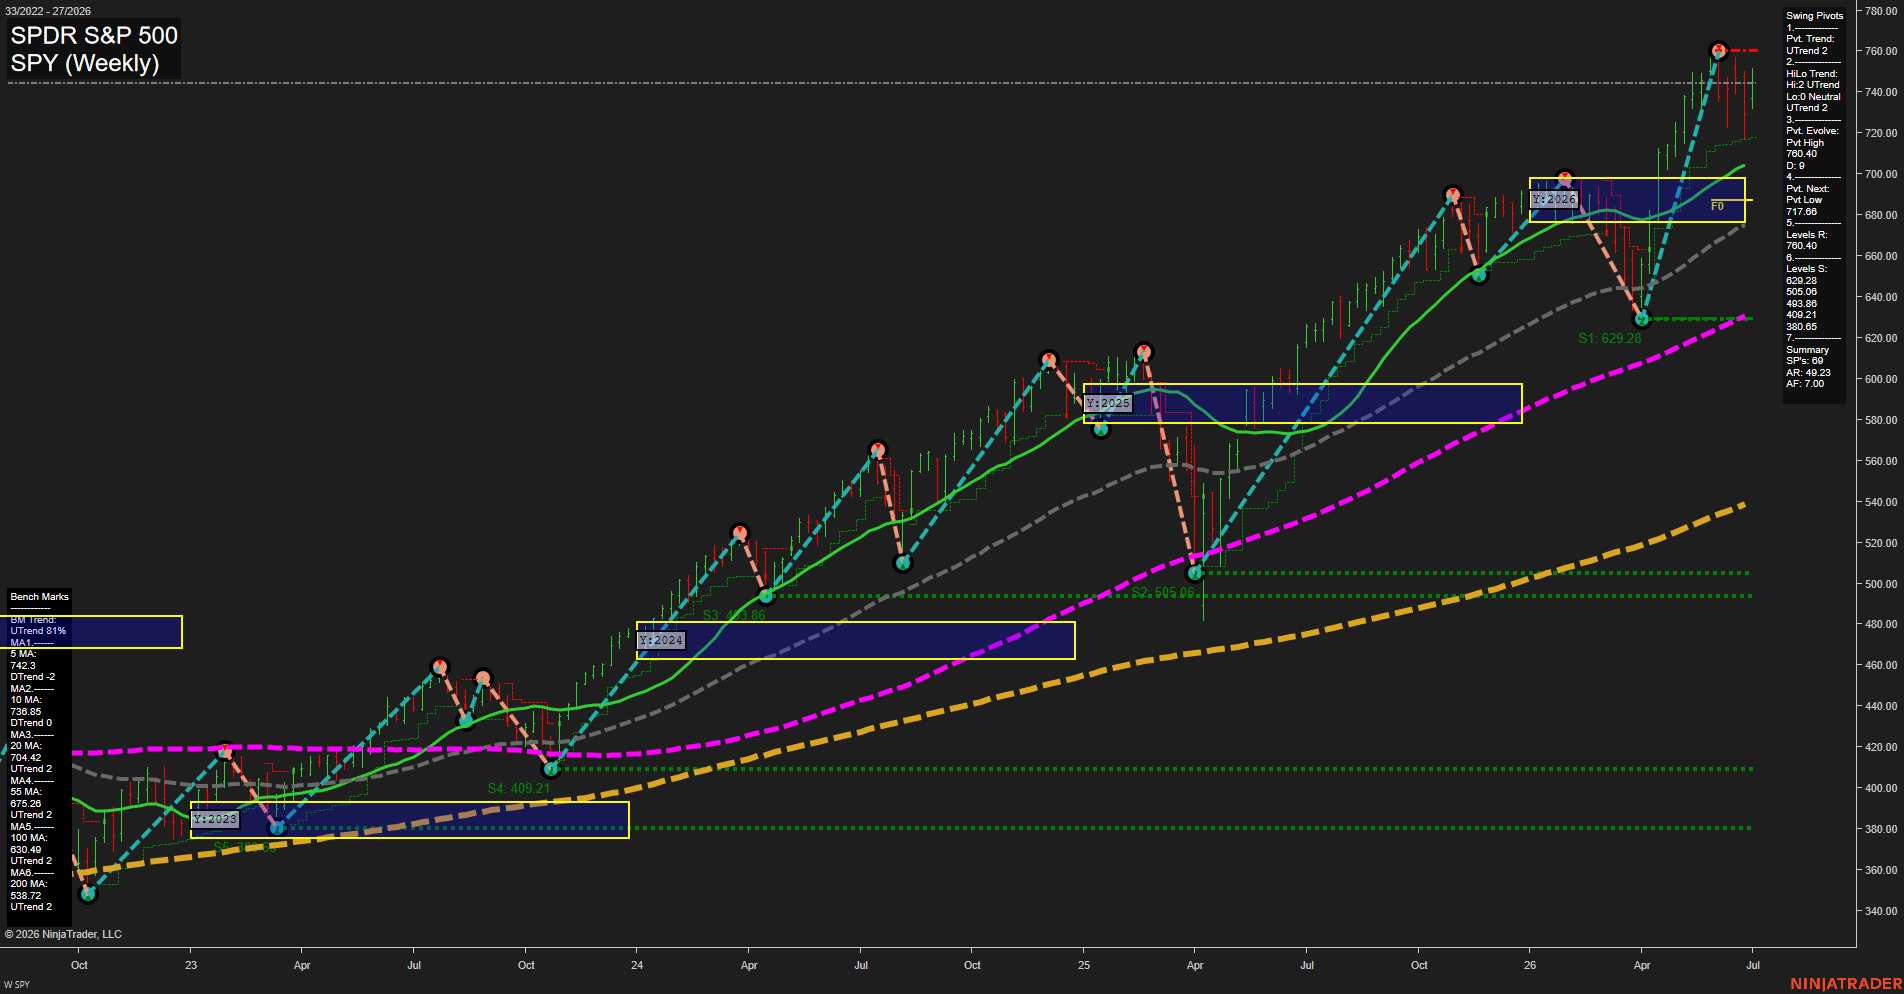
SPY SPDR S&P 500 Weekly Chart Analysis: 2026-Jul-06 07:07 CT
Price Action
- Last: 738.0,
- Bars: Large,
- Mom: Fast.
WSFG Weekly
- Short-Term
- WSFG Current: NA%
- F0%/NTZ' Bias: Price Neutral,
- WSFG Trend: Neutral.
MSFG Month Jul
- Intermediate-Term
- MSFG Current: NA%
- F0%/NTZ' Bias: Price Neutral,
- MSFG Trend: Neutral.
YSFG Year 2026
- Long-Term
- YSFG Current: NA%
- F0%/NTZ' Bias: Price Neutral,
- YSFG Trend: Neutral.
Swing Pivots
- (Short-Term) 1. Pvt. Trend: UTrend,
- (Intermediate-Term) 2. HiLo Trend: UTrend,
- 3. Pvt. Evolve: Pvt High 760.40,
- 4. Pvt. Next: Pvt Low 717.66,
- 5. Levels R: 760.40,
- 6. Levels S: 629.28, 505.06, 493.86, 409.21, 380.65.
Weekly Benchmarks
- (Short-Term) 5 Day: 742.30 Down Trend,
- (Short-Term) 10 Day: 736.85 Down Trend,
- (Intermediate-Term) 20 Day: 704.42 Up Trend,
- (Intermediate-Term) 55 Day: 675.26 Up Trend,
- (Long-Term) 100 Day: 630.49 Up Trend,
- (Long-Term) 200 Day: 538.72 Up Trend.
Overall Rating
- Short-Term: Bullish,
- Intermediate-Term: Bullish,
- Long-Term: Bullish.
Key Insights Summary
SPY remains in a dominant secular uptrend with price still stacked above the 20, 55, 100, and 200 week benchmarks, keeping the intermediate and long-term structure constructive. The latest weekly action shows a sharp expansion off the prior pullback and a push to fresh highs near 760.40, followed by a fast retracement back toward the upper 700s, which reflects strong trend momentum with a near-term pullback phase. The pivot structure stays positive with UTrend readings on both the short-term pivot and the higher-lower framework, while the next downside pivot sits at 717.66. The yearly 2026 fib box is holding near the upper band, showing the market is still operating in an elevated trend zone rather than a broad breakdown phase. Overall, the tape is bullish, with short-term volatility inside an established higher-high, higher-low advance.
Chart Analysis ATS AI Generated: 2026-07-06 07:07 for Informational use only, not trading advice. Terms and Risk Disclosure Copyright © 2026. Algo Trading Systems LLC.