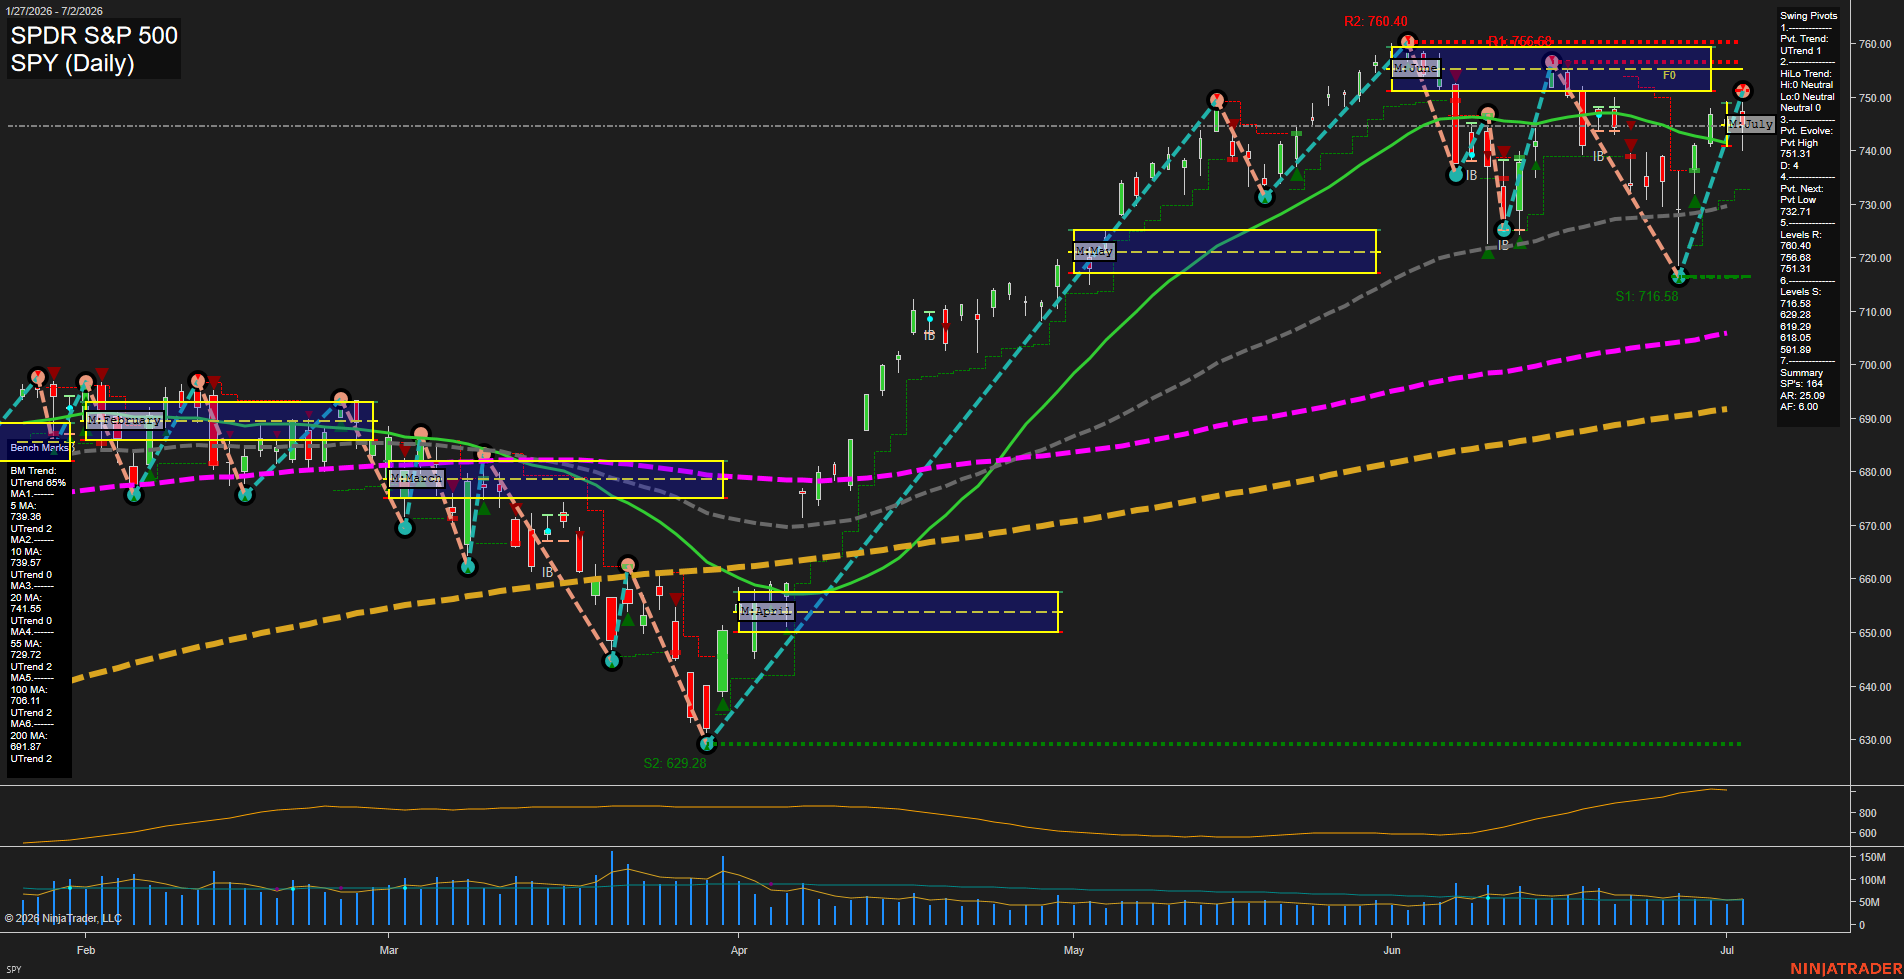
SPY SPDR S&P 500 Daily Chart Analysis: 2026-Jul-06 07:07 CT
Price Action
- Last: 751.31,
- Bars: Small,
- Mom: average.
WSFG Weekly
- Short-Term
- WSFG Current: NA%
- F0%/NTZ' Bias: Price Neutral,
- WSFG Trend: Neutral.
MSFG Month Jul
- Intermediate-Term
- MSFG Current: NA%
- F0%/NTZ' Bias: Price Neutral,
- MSFG Trend: Neutral.
YSFG Year 2026
- Long-Term
- YSFG Current: NA%
- F0%/NTZ' Bias: Price Neutral,
- YSFG Trend: Neutral.
Swing Pivots
- (Short-Term) 1. Pvt. Trend: UTrend,
- (Intermediate-Term) 2. HiLo Trend: UTrend,
- 3. Pvt. Evolve: Pvt High 751.31,
- 4. Pvt. Next: Pvt Low 732.71,
- 5. Levels R: 760.40, 756.68, 751.31,
- 6. Levels S: 716.58, 629.28, 619.29, 618.05, 591.89.
Daily Benchmarks
- (Short-Term) 5 Day: 739.36 Up Trend,
- (Short-Term) 10 Day: 739.57 Up Trend,
- (Intermediate-Term) 20 Day: 741.95 Up Trend,
- (Intermediate-Term) 55 Day: 729.72 Up Trend,
- (Long-Term) 100 Day: 706.11 Up Trend,
- (Long-Term) 200 Day: 691.87 Up Trend.
Additional Metrics
- ATR: 564,
- VOLMA: 47470907.
Overall Rating
- Short-Term: Neutral,
- Intermediate-Term: Bullish,
- Long-Term: Bullish.
Key Insights Summary
SPY remains in a broad uptrend on the daily swing structure, with price holding above the 20, 55, 100, and 200 day benchmarks and the benchmark stack still positively aligned. The latest leg has pressed back into the upper monthly session fib zone near the prior swing high band, creating a stretched but still constructive tape after the June rally and pullback/rebound sequence. Swing pivots continue to favor an upside-biased intermediate structure, while the short-term pivot rhythm has turned back to a fresh high evolution, leaving the next pivot reference on the lower side. Near-term action looks more rotational than impulsive, with price working around the upper resistance cluster rather than in a clean breakout expansion, so the daily profile reads as a consolidation inside an elevated trend rather than a reversal. Volatility remains active but not extreme relative to the rally phase, and the chart context supports a bullish longer-term posture with a neutral short-term tone due to the recent back-and-forth around overhead pivot resistance.
Chart Analysis ATS AI Generated: 2026-07-06 07:07 for Informational use only, not trading advice. Terms and Risk Disclosure Copyright © 2026. Algo Trading Systems LLC.