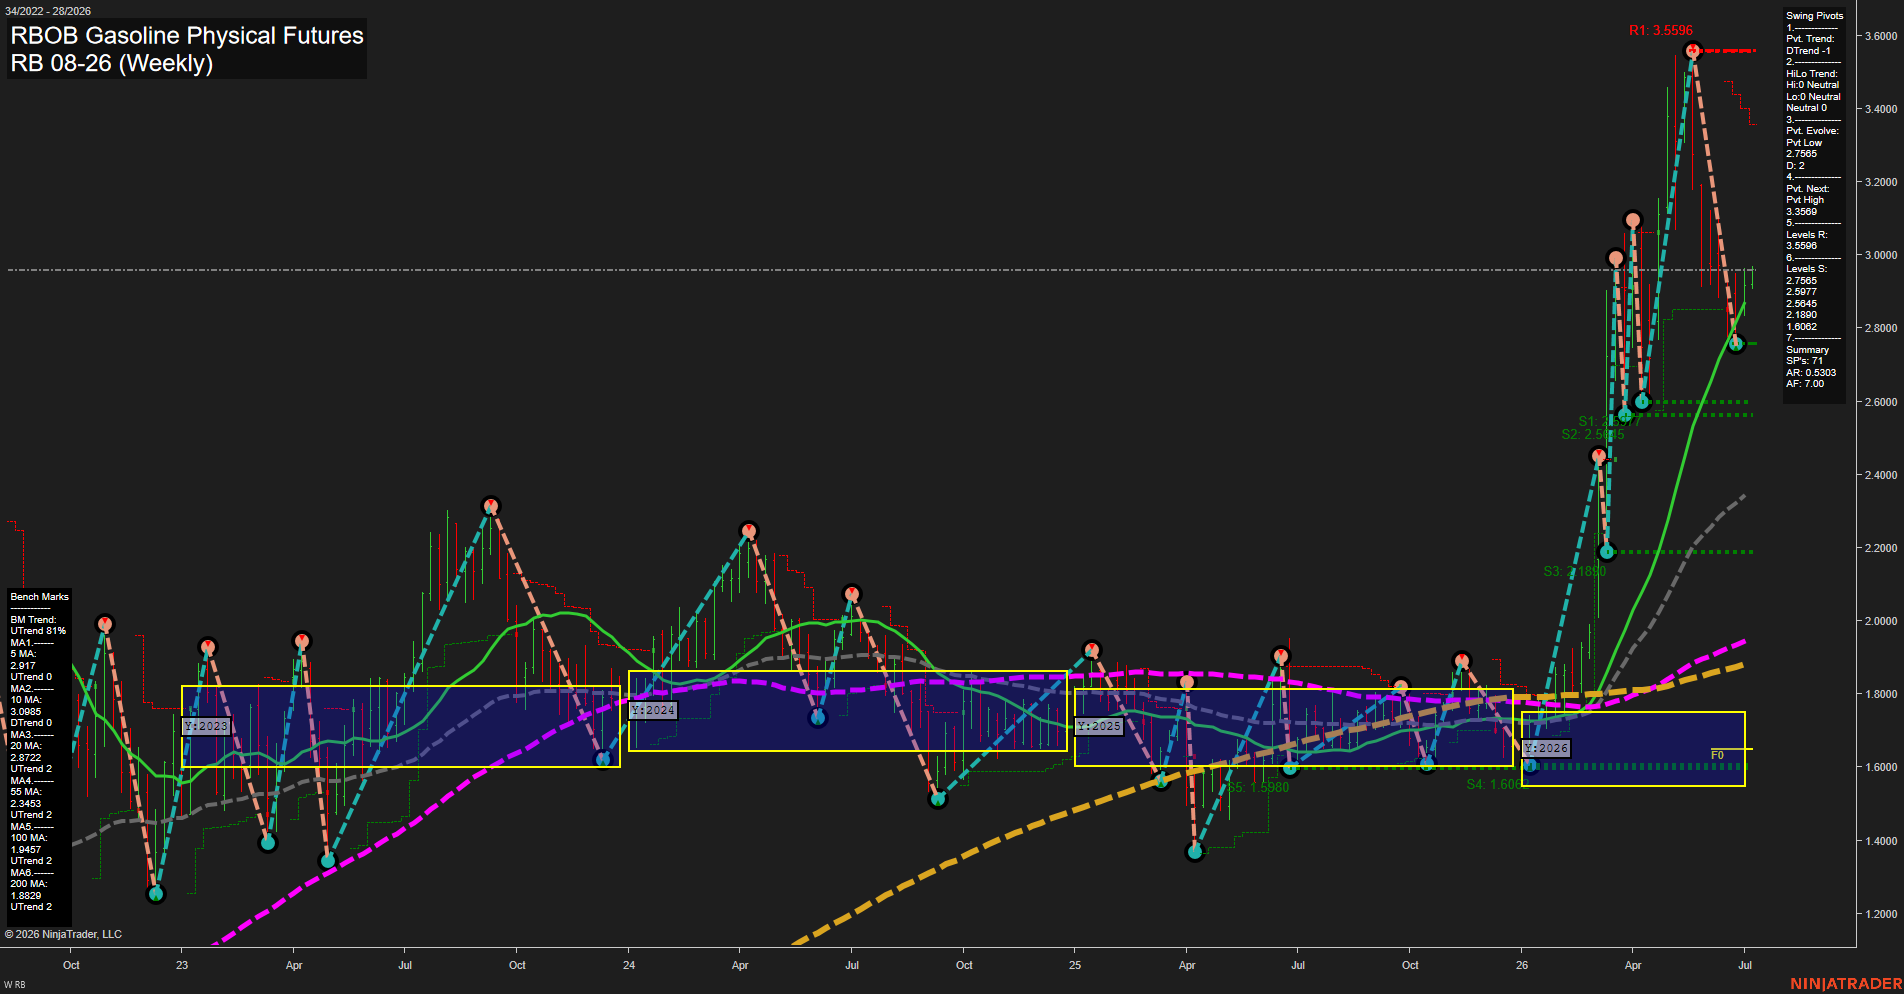
RB RBOB Gasoline Physical Futures Weekly Chart Analysis: 2026-Jul-06 07:06 CT
Price Action
- Last: 2.89,
- Bars: Large,
- Mom: fast.
WSFG Weekly
- Short-Term
- WSFG Current: 9%
- F0%/NTZ' Bias: Price Above,
- WSFG Trend: Up.
MSFG Month Jul
- Intermediate-Term
- MSFG Current: 5%
- F0%/NTZ' Bias: Price Above,
- MSFG Trend: Up.
YSFG Year 2026
- Long-Term
- YSFG Current: 131%
- F0%/NTZ' Bias: Price Above,
- YSFG Trend: Up.
Swing Pivots
- (Short-Term) 1. Pvt. Trend: DTrend,
- (Intermediate-Term) 2. HiLo Trend: DTrend,
- 3. Pvt. Evolve: Pvt Low 2.7565,
- 4. Pvt. Next: Pvt High 3.3569,
- 5. Levels R: 3.5596,
- 6. Levels S: 2.7565, 2.5977, 2.5845, 2.1890, 1.6062.
Weekly Benchmarks
- (Short-Term) 5 Day: 2.917 Up Trend,
- (Short-Term) 10 Day: 3.0895 Down Trend,
- (Intermediate-Term) 20 Day: 2.8722 Up Trend,
- (Intermediate-Term) 55 Day: 2.3436 Up Trend,
- (Long-Term) 100 Day: 1.9457 Up Trend,
- (Long-Term) 200 Day: 1.8829 Up Trend.
Recent Trade Signals
- 06 Jul 2026: Long RB 08-26 @ 2.9608 Signals.USAR-WSFG
- 03 Jul 2026: Long RB 08-26 @ 2.9539 Signals.USAR.TR120
- 29 Jun 2026: Short RB 08-26 @ 2.8537 Signals.USAR-MSFG
Overall Rating
- Short-Term: Neutral,
- Intermediate-Term: Bullish,
- Long-Term: Bullish.
Key Insights Summary
RB gasoline weekly structure remains in a strong higher-timeframe uptrend, with both the monthly and yearly session fib grids holding price above F0% and pointing up. The market has just completed a fast, large weekly expansion from the mid-2.1s into the 3.5s, then backed off sharply, leaving the short-term pivot trend in a down phase even though the broader benchmark stack remains constructive. The 10-day benchmark has rolled lower versus price, while the 20/55/100/200-day averages are still aligned upward, showing that the larger trend structure is intact. Recent long signals sit against the backdrop of a deep post-spike retracement, with swing pivot resistance marked near 3.5596 and layered support stepping down through 2.7565, 2.5977, 2.5845, 2.1890, and 1.6062. The chart reads as a volatile breakout-and-retracement cycle inside a still-bullish macro framework.
Chart Analysis ATS AI Generated: 2026-07-06 07:06 for Informational use only, not trading advice. Terms and Risk Disclosure Copyright © 2026. Algo Trading Systems LLC.