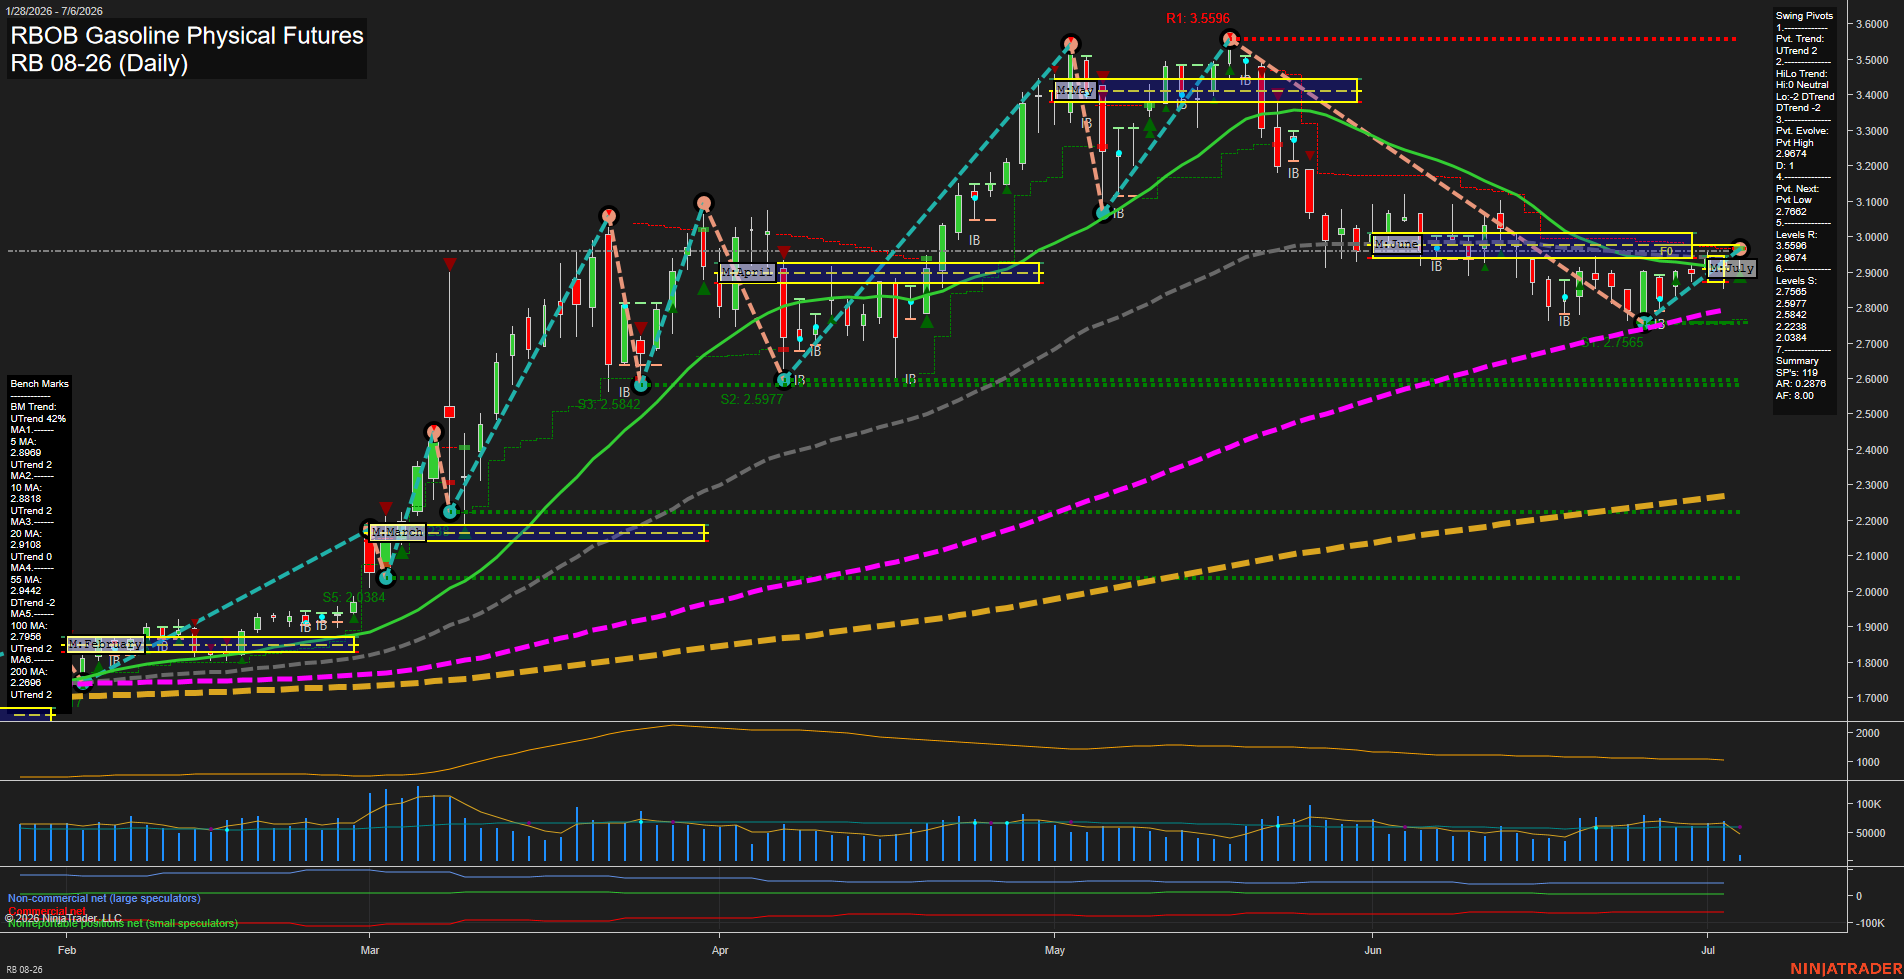
RB RBOB Gasoline Physical Futures Daily Chart Analysis: 2026-Jul-06 07:05 CT
Price Action
- Last: 2.9560,
- Bars: Medium,
- Mom: slow.
WSFG Weekly
- Short-Term
- WSFG Current: 9%
- F0%/NTZ' Bias: Price Above,
- WSFG Trend: Up.
MSFG Month Jul
- Intermediate-Term
- MSFG Current: 5%
- F0%/NTZ' Bias: Price Above,
- MSFG Trend: Up.
YSFG Year 2026
- Long-Term
- YSFG Current: 131%
- F0%/NTZ' Bias: Price Above,
- YSFG Trend: Up.
Swing Pivots
- (Short-Term) 1. Pvt. Trend: UTrend,
- (Intermediate-Term) 2. HiLo Trend: DTrend,
- 3. Pvt. Evolve: Pvt High 2.9674,
- 4. Pvt. Next: Pvt Low 2.7682,
- 5. Levels R: 3.5596, 2.9674,
- 6. Levels S: 2.7565, 2.5977, 2.5842, 2.2238, 2.0384.
Daily Benchmarks
- (Short-Term) 5 Day: 2.8969 Up Trend,
- (Short-Term) 10 Day: 2.8818 Up Trend,
- (Intermediate-Term) 20 Day: 2.9108 Up Trend,
- (Intermediate-Term) 55 Day: 2.9442 Down Trend,
- (Long-Term) 100 Day: 2.7698 Up Trend,
- (Long-Term) 200 Day: 2.2869 Up Trend.
Additional Metrics
Recent Trade Signals
- 06 Jul 2026: Long RB 08-26 @ 2.9608 Signals.USAR-WSFG
- 03 Jul 2026: Long RB 08-26 @ 2.9539 Signals.USAR.TR120
- 29 Jun 2026: Short RB 08-26 @ 2.8537 Signals.USAR-MSFG
Overall Rating
- Short-Term: Bullish,
- Intermediate-Term: Bullish,
- Long-Term: Bullish.
Key Insights Summary
RB RBOB gasoline remains in a broad uptrend across the weekly, monthly, and yearly session fib structure, with price holding above the NTZ/f0% bands and trading near the upper end of the recent consolidation zone around 2.90-3.00. The short-term pivot trend is still constructive, while the intermediate pivot structure has softened after the May peak and June decline, leaving a mixed-to-stabilizing profile beneath the 55-day average. Price is currently clustered around the 5/10/20-day benchmarks and just under the 55-day, which reflects a market that has rebounded from the June pullback but is still working through overhead supply from the prior swing highs. The nearby resistance focus is the 2.9674 pivot high and then the 3.5596 level, while support sits first at 2.7565 and then the deeper pivot layers below. Overall, the chart shows a bullish larger trend with a short-term repair phase and a consolidation/recovery pattern after the June selloff.
Chart Analysis ATS AI Generated: 2026-07-06 07:06 for Informational use only, not trading advice. Terms and Risk Disclosure Copyright © 2026. Algo Trading Systems LLC.