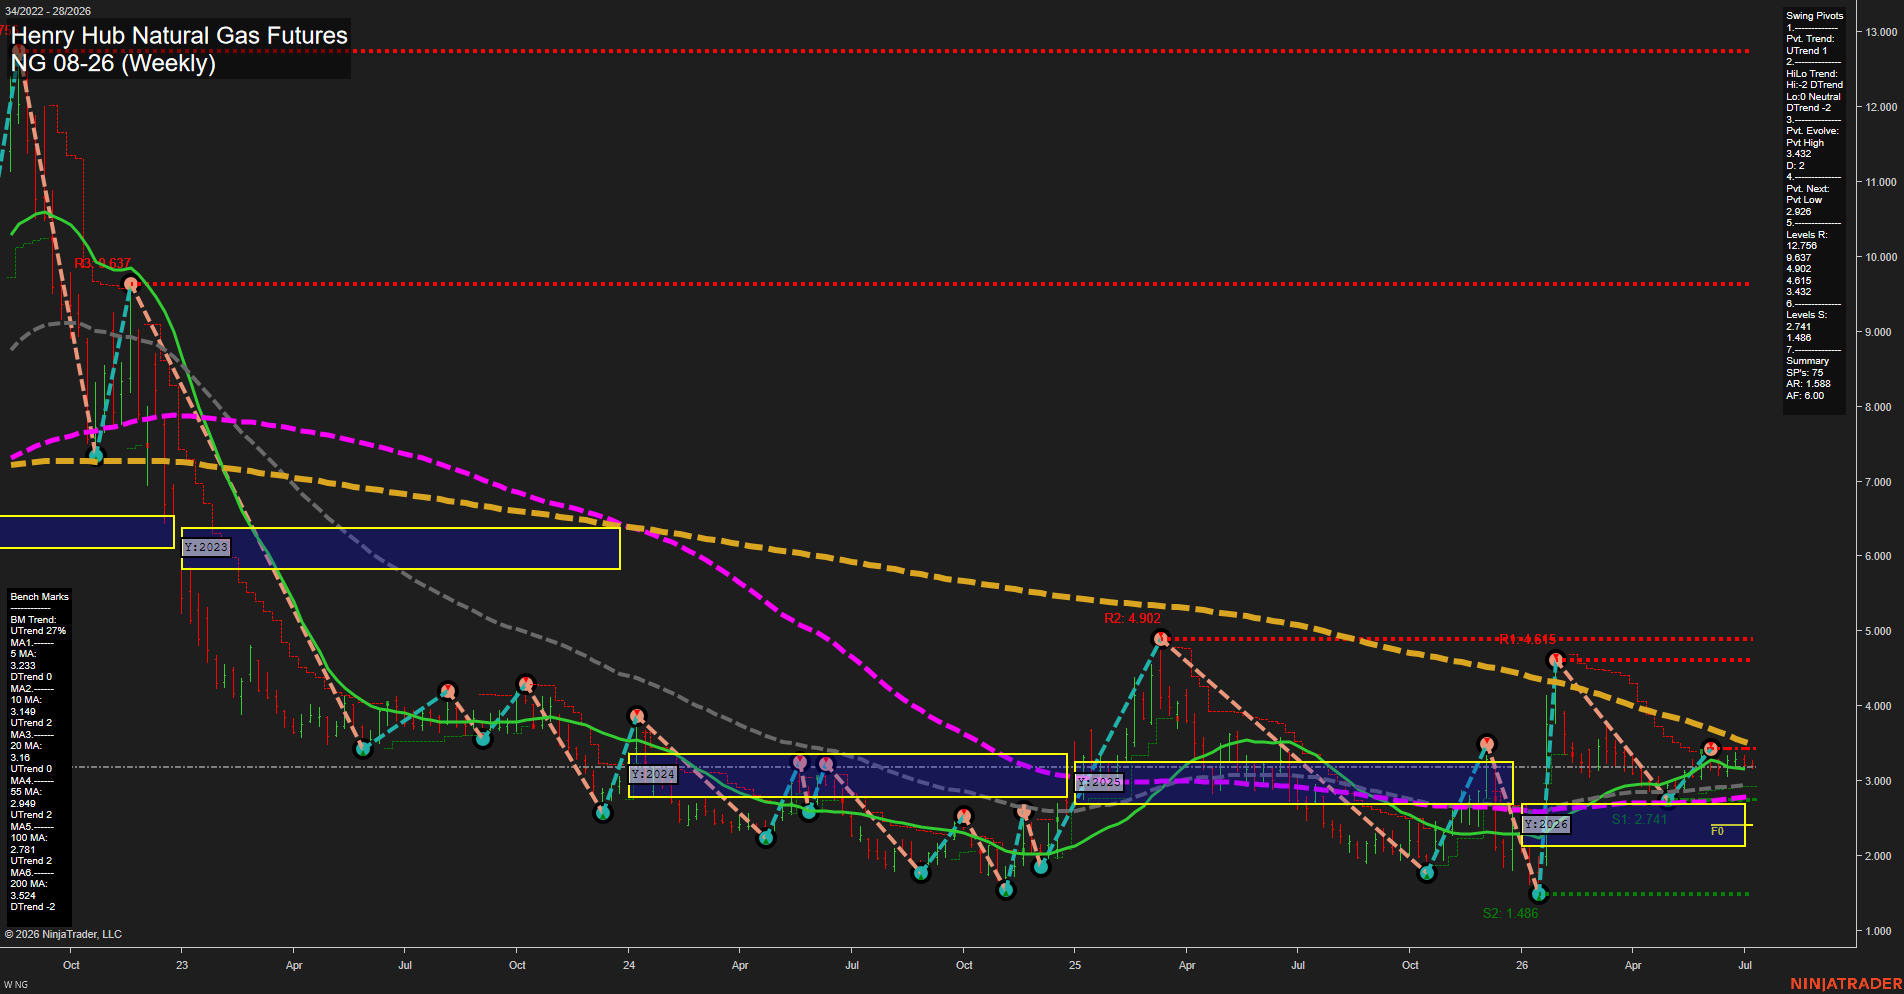
NG Henry Hub Natural Gas Futures Weekly Chart Analysis: 2026-Jul-06 07:04 CT
Price Action
- Last: 3.233,
- Bars: Medium,
- Mom: slow.
WSFG Weekly
- Short-Term
- WSFG Current: 10%
- F0%/NTZ' Bias: Price Above,
- WSFG Trend: Up.
MSFG Month Jul
- Intermediate-Term
- MSFG Current: -5%
- F0%/NTZ' Bias: Price Below,
- MSFG Trend: Down.
YSFG Year 2026
- Long-Term
- YSFG Current: 29%
- F0%/NTZ' Bias: Price Above,
- YSFG Trend: Up.
Swing Pivots
- (Short-Term) 1. Pvt. Trend: UTrend,
- (Intermediate-Term) 2. HiLo Trend: DTrend,
- 3. Pvt. Evolve: Pvt High 3.432,
- 4. Pvt. Next: Pvt Low 2.926,
- 5. Levels R: 12.756, 9.637, 4.902, 4.615, 3.432,
- 6. Levels S: 2.741, 1.486.
Weekly Benchmarks
- (Short-Term) 5 Day: 3.233 Up Trend,
- (Short-Term) 10 Day: 3.149 Down Trend,
- (Intermediate-Term) 20 Day: 3.160 Up Trend,
- (Intermediate-Term) 55 Day: 2.949 Up Trend,
- (Long-Term) 100 Day: 2.781 Up Trend,
- (Long-Term) 200 Day: 3.524 Down Trend.
Recent Trade Signals
- 06 Jul 2026: Long NG 08-26 @ 3.231 Signals.USAR-WSFG
- 06 Jul 2026: Short NG 08-26 @ 3.165 Signals.USAR-MSFG
- 06 Jul 2026: Short NG 08-26 @ 3.165 Signals.USAR.TR120
- 06 Jul 2026: Short NG 08-26 @ 3.165 Signals.USAR.TR720
Overall Rating
- Short-Term: Bullish,
- Intermediate-Term: Bearish,
- Long-Term: Bullish.
Key Insights Summary
Natural gas is trading in a mixed but constructive swing structure: the weekly session grid is positive, the yearly grid remains positive, and price is holding above the key weekly and yearly midpoint zones near 3.23. The short-term pivot trend is still UTrend, matching the latest weekly long signal, but the intermediate swing structure is softer because the monthly grid is negative and the HiLo pivot trend is DTrend. Price is sitting below the 200-day benchmark while remaining above the 20/55/100-day cluster, which points to a market that has repaired from the winter/spring decline yet still needs to work through overhead supply near 3.43, 4.61, and 4.90. The recent path shows a sharp recovery from the early-2026 washout followed by a broad consolidation around the low-3s, with lower volatility than the prior impulse legs and a slow momentum profile consistent with a sideways-to-rising weekly base.
Chart Analysis ATS AI Generated: 2026-07-06 07:04 for Informational use only, not trading advice. Terms and Risk Disclosure Copyright © 2026. Algo Trading Systems LLC.