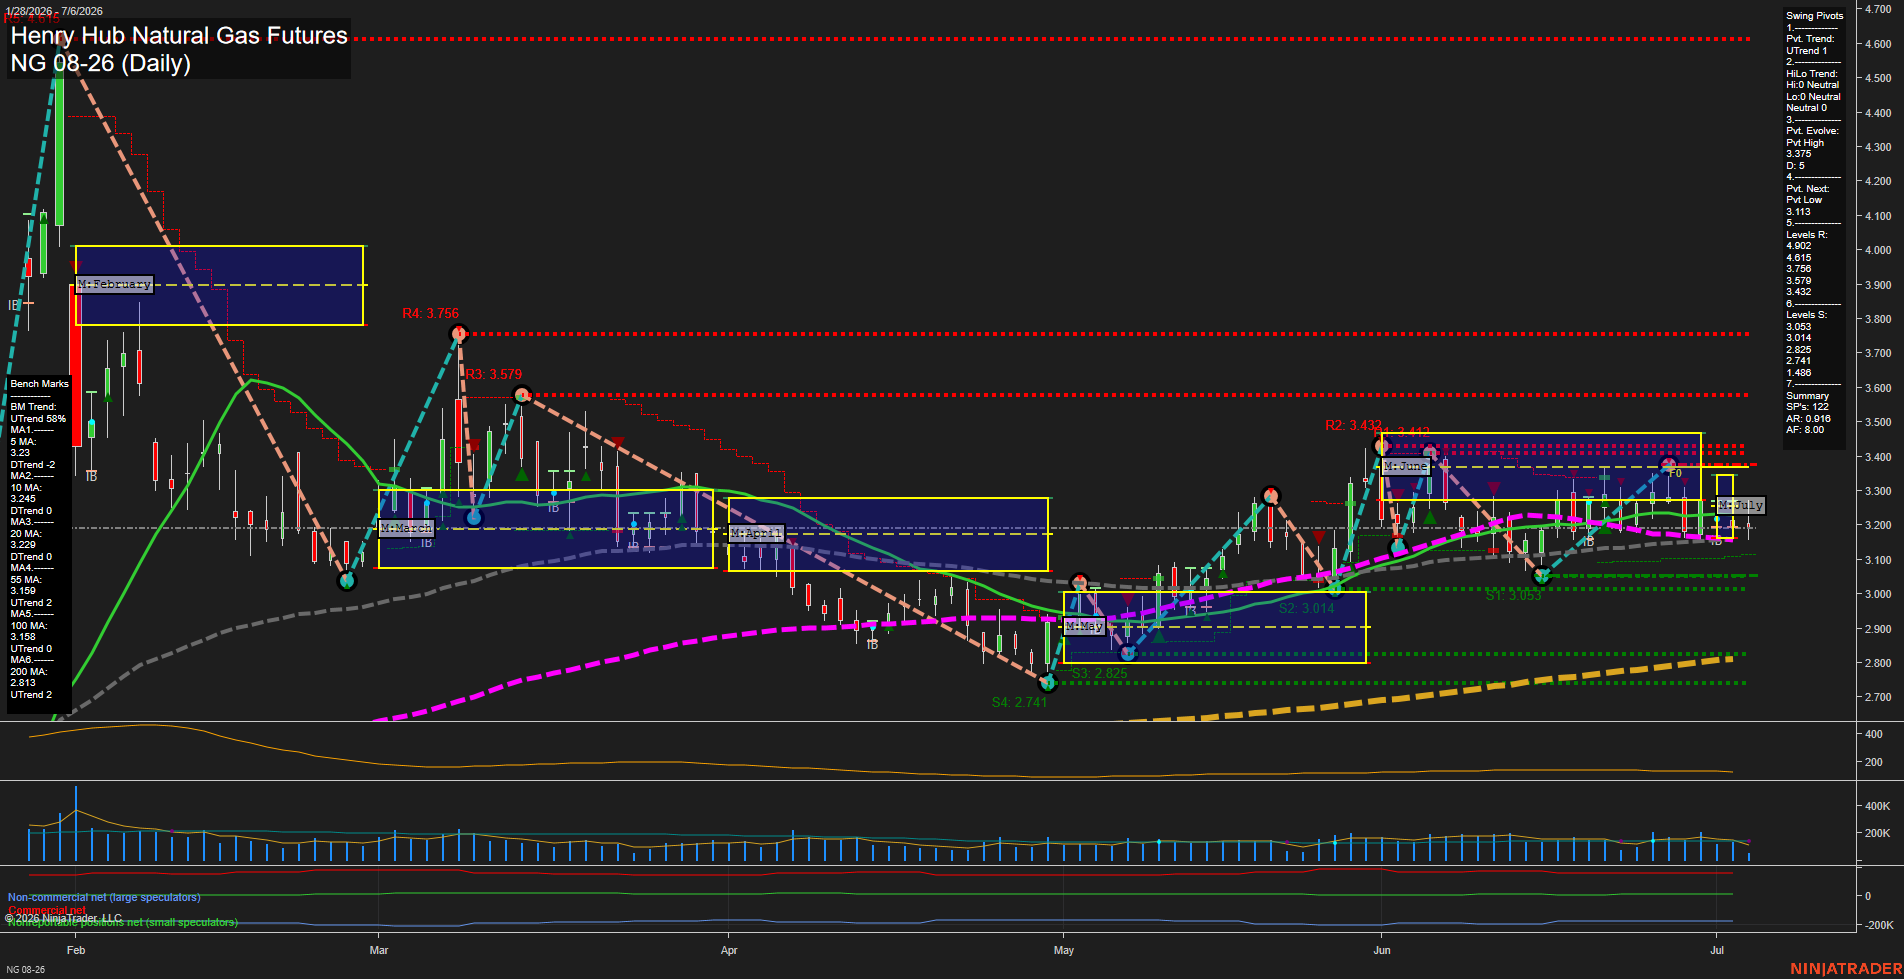
NG Henry Hub Natural Gas Futures Daily Chart Analysis: 2026-Jul-06 07:04 CT
Price Action
- Last: 3.231,
- Bars: Medium,
- Mom: average.
WSFG Weekly
- Short-Term
- WSFG Current: 10%
- F0%/NTZ' Bias: Price Above,
- WSFG Trend: Up.
MSFG Month Jul
- Intermediate-Term
- MSFG Current: -5%
- F0%/NTZ' Bias: Price Below,
- MSFG Trend: Down.
YSFG Year 2026
- Long-Term
- YSFG Current: 29%
- F0%/NTZ' Bias: Price Above,
- YSFG Trend: Up.
Swing Pivots
- (Short-Term) 1. Pvt. Trend: UTrend,
- (Intermediate-Term) 2. HiLo Trend: UTrend,
- 3. Pvt. Evolve: Pvt High 3.375,
- 4. Pvt. Next: Pvt Low 3.113,
- 5. Levels R: 4.902, 4.615, 3.756, 3.579, 3.432,
- 6. Levels S: 3.053, 3.014, 2.825, 2.741, 1.486.
Daily Benchmarks
- (Short-Term) 5 Day: 3.230 Down Trend,
- (Short-Term) 10 Day: 3.245 Down Trend,
- (Intermediate-Term) 20 Day: 3.229 Down Trend,
- (Intermediate-Term) 55 Day: 3.159 Up Trend,
- (Long-Term) 100 Day: 3.158 Up Trend,
- (Long-Term) 200 Day: 2.813 Up Trend.
Additional Metrics
Recent Trade Signals
- 06 Jul 2026: Long NG 08-26 @ 3.231 Signals.USAR-WSFG
- 06 Jul 2026: Short NG 08-26 @ 3.165 Signals.USAR-MSFG
- 06 Jul 2026: Short NG 08-26 @ 3.165 Signals.USAR.TR120
Overall Rating
- Short-Term: Neutral,
- Intermediate-Term: Neutral,
- Long-Term: Bullish.
Key Insights Summary
Natural gas is trading in a mixed swing structure with price near the 3.23 area, holding above the weekly fib grid bias while still sitting below the current monthly fib grid center, which keeps the daily tape balanced rather than cleanly directional. The pivot structure remains in an established uptrend with higher swing reference points intact, but the nearby resistance stack overhead and the cluster of moving averages around the current price zone point to a consolidation phase after the earlier June recovery. Short-term momentum is moderate rather than impulsive, and the benchmark profile shows the faster averages flattening while the medium- and long-term averages remain supportive. That combination leaves the chart in a rotational regime: monthly pressure versus weekly strength, with the broader year-to-date structure still constructive and the long-term trend preserved.
Chart Analysis ATS AI Generated: 2026-07-06 07:04 for Informational use only, not trading advice. Terms and Risk Disclosure Copyright © 2026. Algo Trading Systems LLC.