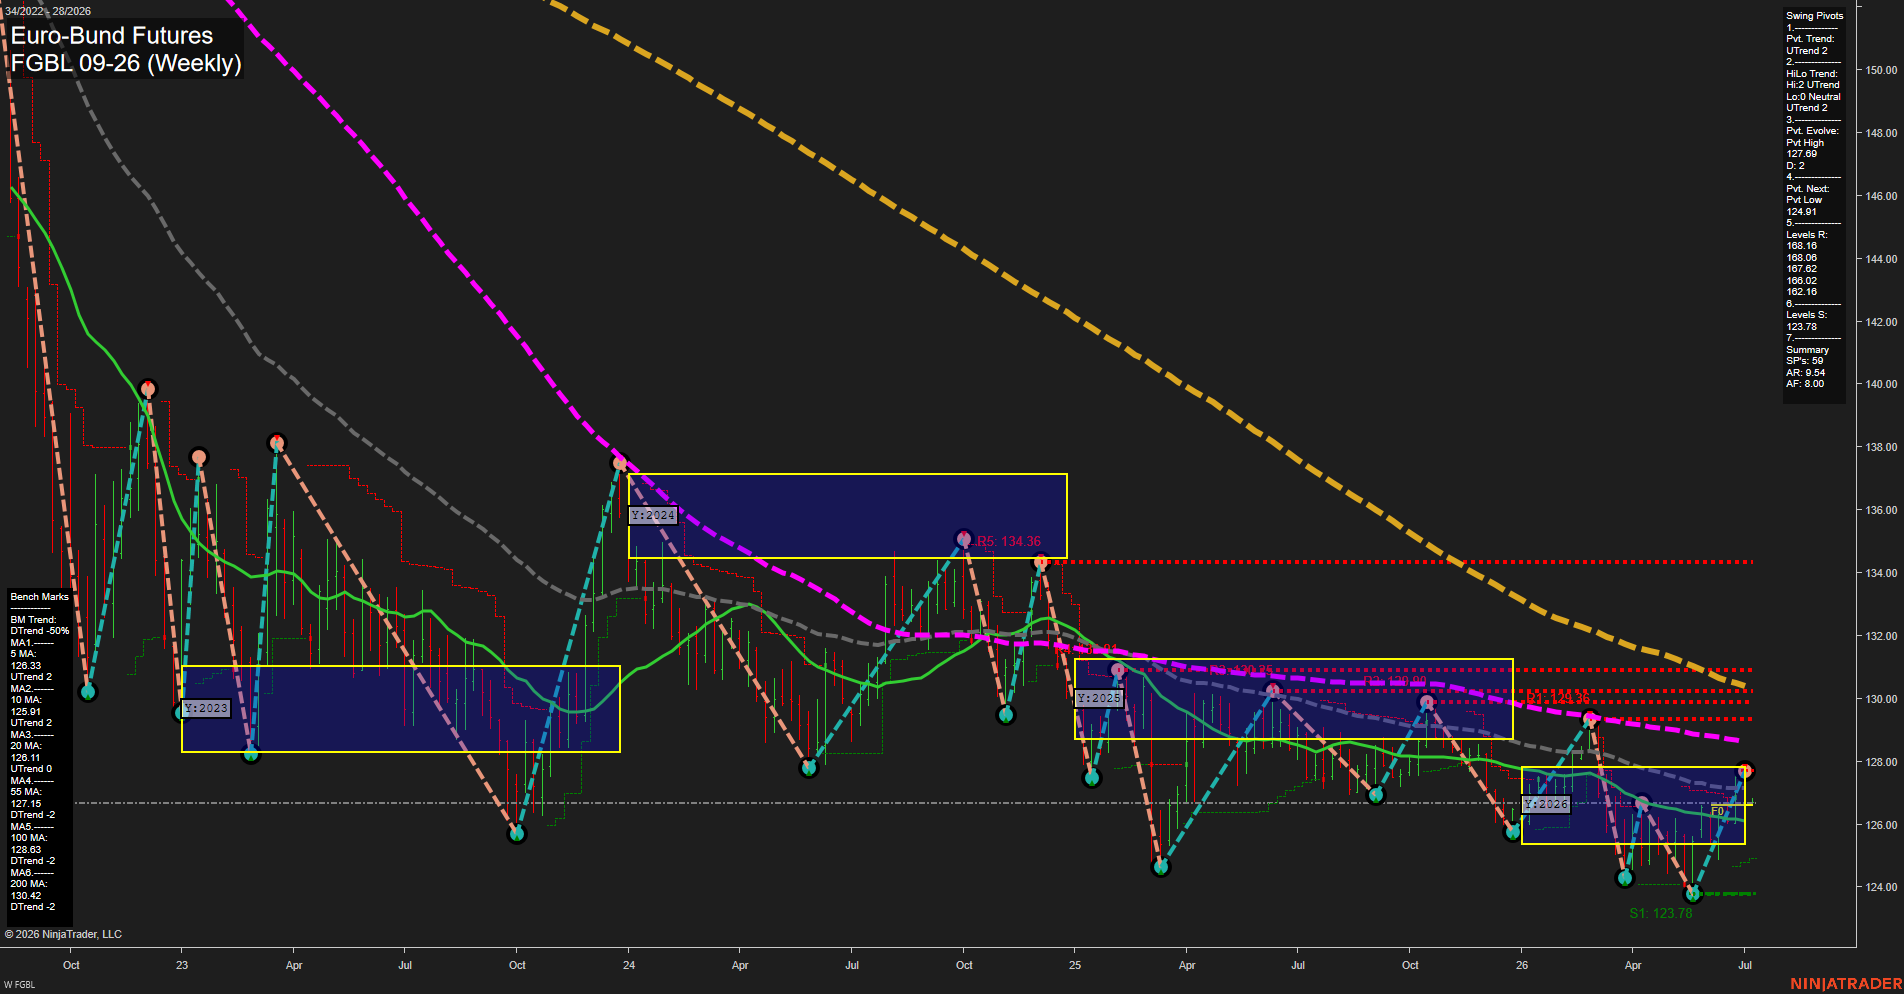
FGBL Euro-Bund Futures Weekly Chart Analysis: 2026-Jul-06 07:03 CT
Price Action
- Last: 127.69,
- Bars: Medium,
- Mom: average.
WSFG Weekly
- Short-Term
- WSFG Current: 6%
- F0%/NTZ' Bias: Price Above,
- WSFG Trend: Up.
MSFG Month Jul
- Intermediate-Term
- MSFG Current: -13%
- F0%/NTZ' Bias: Price Below,
- MSFG Trend: Down.
YSFG Year 2026
- Long-Term
- YSFG Current: 0%
- F0%/NTZ' Bias: Price Neutral,
- YSFG Trend: Neutral.
Swing Pivots
- (Short-Term) 1. Pvt. Trend: UTrend,
- (Intermediate-Term) 2. HiLo Trend: UTrend,
- 3. Pvt. Evolve: Pvt High 127.69,
- 4. Pvt. Next: Pvt Low 124.91,
- 5. Levels R: 134.36, 130.25, 129.00, 128.62,
- 6. Levels S: 123.78.
Weekly Benchmarks
- (Short-Term) 5 Day: 126.33 Up Trend,
- (Short-Term) 10 Day: 125.91 Up Trend,
- (Intermediate-Term) 20 Day: 126.11 Up Trend,
- (Intermediate-Term) 55 Day: 127.15 Down Trend,
- (Long-Term) 100 Day: 128.63 Down Trend,
- (Long-Term) 200 Day: 130.42 Down Trend.
Recent Trade Signals
- 06 Jul 2026: Long FGBL 09-26 @ 126.79 Signals.USAR-WSFG
- 06 Jul 2026: Short FGBL 09-26 @ 126.61 Signals.USAR-MSFG
Overall Rating
- Short-Term: Bullish,
- Intermediate-Term: Bearish,
- Long-Term: Bearish.
Key Insights Summary
The weekly structure remains in a short-term upswing, with price holding above the weekly F0%/NTZ zone and the pivot trend still marked UTrend. The latest push has lifted price back into the upper part of the current yearly session box, but the broader tape remains capped by overhead resistance clustered around the 128.6 to 130.3 area, where prior swing highs and declining benchmark averages converge. Intermediate-term tone is still weak because the monthly session grid is negative and the 55, 100, and 200 day benchmarks remain in down trends, keeping the broader profile biased to lower highs and rotational rallies. The yearly grid is neutral, reflecting a range-bound long-cycle backdrop rather than a clean breakout regime. Overall, the chart shows a constructive weekly rebound inside a larger bearish-to-neutral structure, with the most recent move resembling a recovery leg rather than a full trend reversal.
Chart Analysis ATS AI Generated: 2026-07-06 07:03 for Informational use only, not trading advice. Terms and Risk Disclosure Copyright © 2026. Algo Trading Systems LLC.