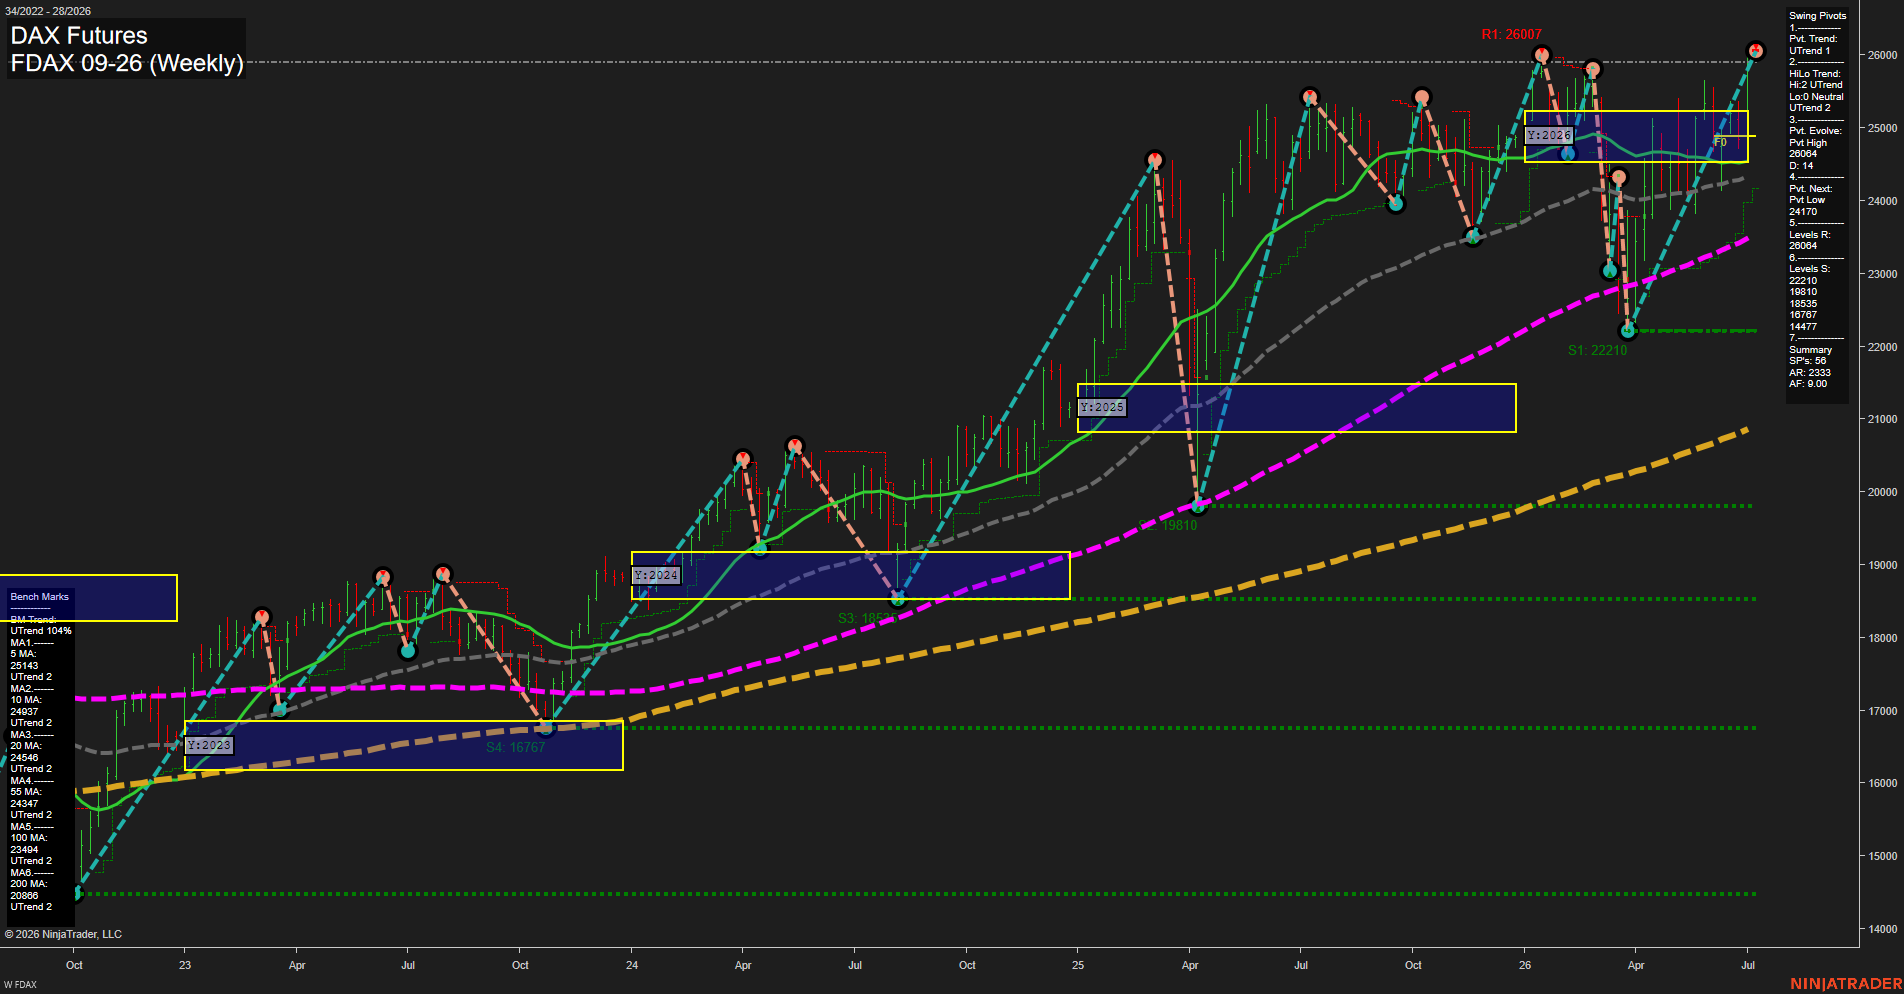
FDAX DAX Futures Weekly Chart Analysis: 2026-Jul-06 07:03 CT
Price Action
- Last: 26064,
- Bars: Large,
- Mom: Fast.
WSFG Weekly
- Short-Term
- WSFG Current: -11%
- F0%/NTZ' Bias: Price Below,
- WSFG Trend: Down.
MSFG Month Jul
- Intermediate-Term
- MSFG Current: 40%
- F0%/NTZ' Bias: Price Above,
- MSFG Trend: Up.
YSFG Year 2026
- Long-Term
- YSFG Current: 29%
- F0%/NTZ' Bias: Price Above,
- YSFG Trend: Up.
Swing Pivots
- (Short-Term) 1. Pvt. Trend: UTrend,
- (Intermediate-Term) 2. HiLo Trend: UTrend,
- 3. Pvt. Evolve: Pvt High 26064,
- 4. Pvt. Next: Pvt Low 24170,
- 5. Levels R: 26064,
- 6. Levels S: 22210, 19810, 18535, 16767, 14477.
Weekly Benchmarks
- (Short-Term) 5 Day: 25143 Up Trend,
- (Short-Term) 10 Day: 24937 Up Trend,
- (Intermediate-Term) 20 Day: 24546 Up Trend,
- (Intermediate-Term) 55 Day: 24347 Up Trend,
- (Long-Term) 100 Day: 23494 Up Trend,
- (Long-Term) 200 Day: 20886 Up Trend.
Recent Trade Signals
- 02 Jul 2026: Long FDAX 09-26 @ 25447 Signals.USAR-MSFG
- 30 Jun 2026: Long FDAX 09-26 @ 25146 Signals.USAR.TR120
- 29 Jun 2026: Short FDAX 09-26 @ 24809 Signals.USAR-WSFG
Overall Rating
- Short-Term: Neutral,
- Intermediate-Term: Bullish,
- Long-Term: Bullish.
Key Insights Summary
FDAX is pressing new highs near 26064 after a strong multi-year advance, with weekly bars expanding and momentum running fast. The short-term WSFG remains negative and below F0%, which shows the current weekly session is still in a down-biased retracement phase even as price holds near the upper extreme of the yearly range. In contrast, the monthly and yearly session grids remain positive and above F0%, keeping the broader swing structure constructive. Swing pivots still point to an uptrend, with the latest pivot high at 26064 and the next meaningful pivot reference down at 24170, while benchmark moving averages stay aligned in a clear bullish stack from 5-day through 200-day. The tape therefore reflects a strong long-term uptrend with a short-term pullback/rotation component, and recent signals show that the market has been alternating between brief countertrend shorts and renewed trend-following longs.
Chart Analysis ATS AI Generated: 2026-07-06 07:03 for Informational use only, not trading advice. Terms and Risk Disclosure Copyright © 2026. Algo Trading Systems LLC.