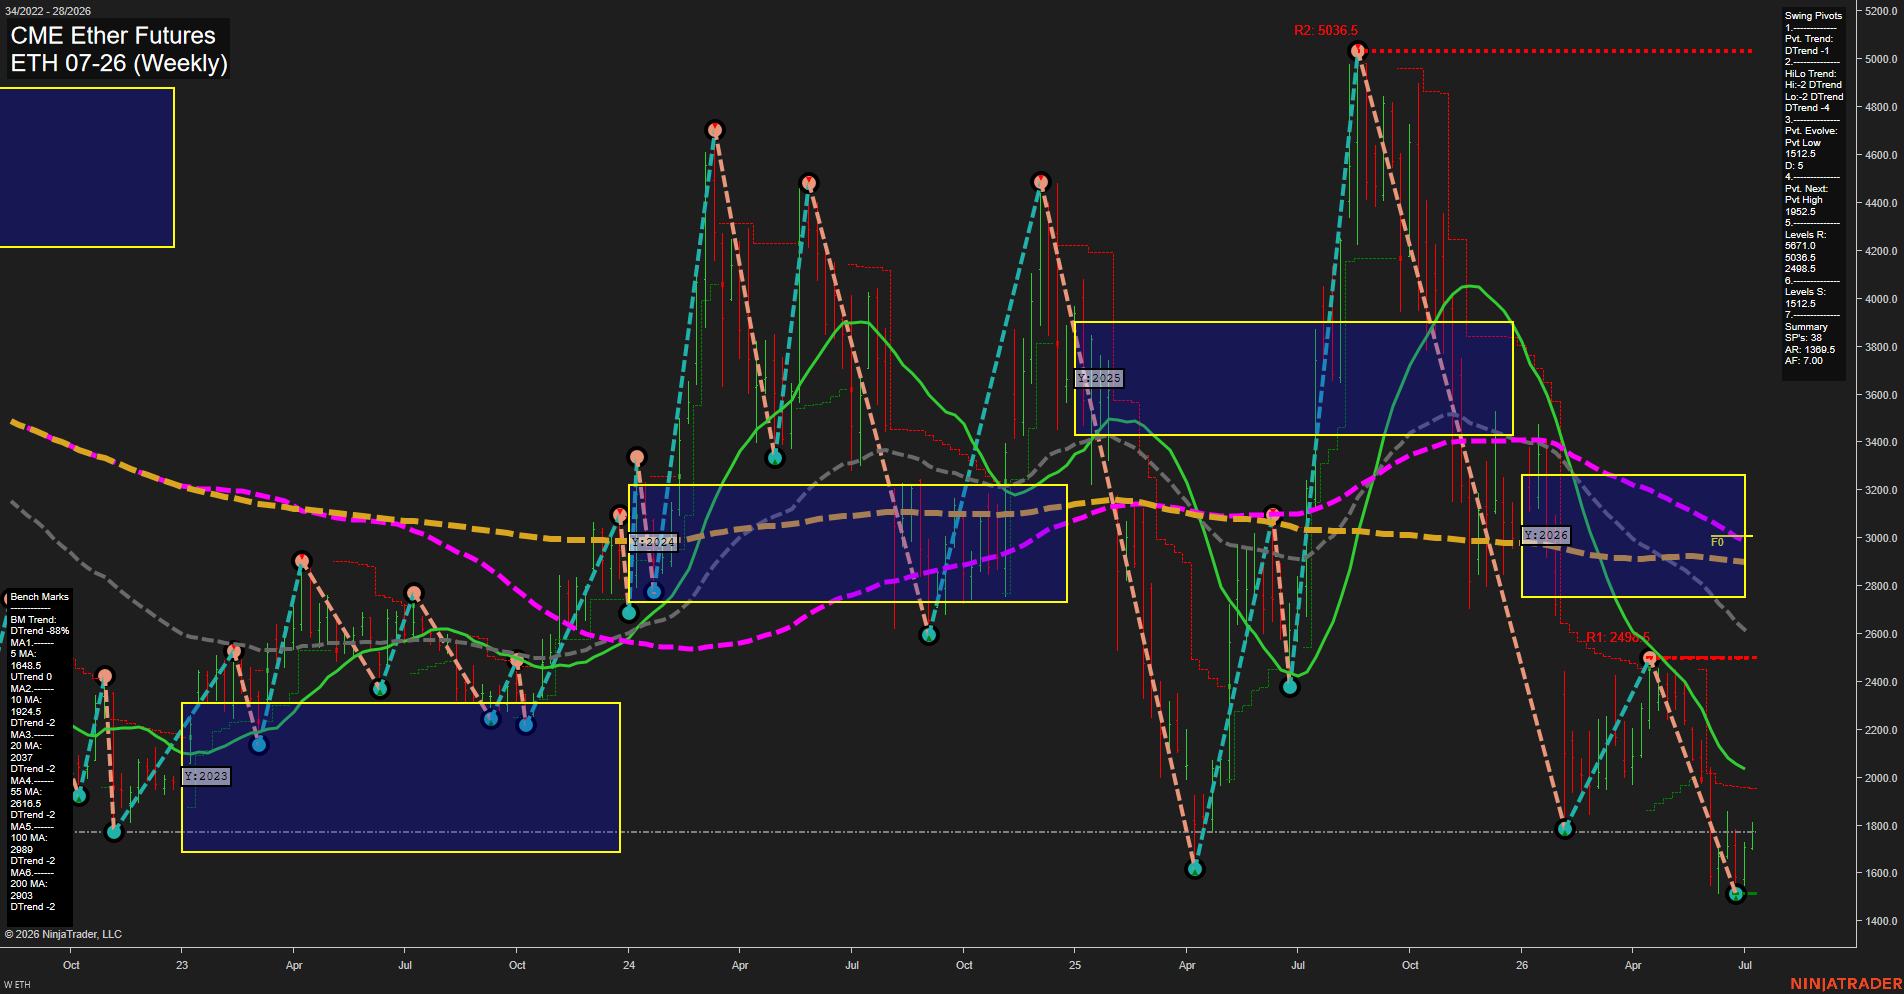
ETH CME Ether Futures Weekly Chart Analysis: 2026-Jul-06 07:03 CT
Price Action
- Last: 1797.5,
- Bars: Medium,
- Mom: fast.
WSFG Weekly
- Short-Term
- WSFG Current: -4%
- F0%/NTZ' Bias: Price Below,
- WSFG Trend: Down.
MSFG Month Jul
- Intermediate-Term
- MSFG Current: 35%
- F0%/NTZ' Bias: Price Above,
- MSFG Trend: Up.
YSFG Year 2026
- Long-Term
- YSFG Current: -48%
- F0%/NTZ' Bias: Price Below,
- YSFG Trend: Down.
Swing Pivots
- (Short-Term) 1. Pvt. Trend: DTrend,
- (Intermediate-Term) 2. HiLo Trend: DTrend,
- 3. Pvt. Evolve: Pvt Low 1512.5,
- 4. Pvt. Next: Pvt High 1952.5,
- 5. Levels R: 5671.0, 5036.5, 2488.5,
- 6. Levels S: 1512.5.
Weekly Benchmarks
- (Short-Term) 5 Day: 1648.5 Up Trend,
- (Short-Term) 10 Day: 1924.5 Down Trend,
- (Intermediate-Term) 20 Day: 2037 Down Trend,
- (Intermediate-Term) 55 Day: 2816.5 Down Trend,
- (Long-Term) 100 Day: 2989 Down Trend,
- (Long-Term) 200 Day: 2803 Down Trend.
Recent Trade Signals
- 06 Jul 2026: Long ETH 07-26 @ 1797.5 Signals.USAR-WSFG
- 02 Jul 2026: Long ETH 07-26 @ 1644.5 Signals.USAR-MSFG
- 01 Jul 2026: Long ETH 07-26 @ 1625.5 Signals.USAR.TR120
Overall Rating
- Short-Term: Bearish,
- Intermediate-Term: Bullish,
- Long-Term: Bearish.
Key Insights Summary
ETH futures are rebounding from a deep year-to-date drawdown, but the weekly structure remains heavy with price still below the yearly F0%/NTZ zone and the long-term benchmark stack. The short-term swing pivot trend is still DTrend, matching the weekly WSFG downside bias and keeping the near-term structure in a corrective phase even as the latest trade signal shows a fresh long from the lower band. Intermediate-term conditions are comparatively firmer because July MSFG is above its F0%/NTZ and marked Up, reflecting a recovery leg within a broader downtrend. The pivot map shows major overhead resistance clustered at 1952.5, then 2488.5, with much larger historical resistance at 5036.5 and 5671.0, while the key swing low support remains 1512.5. Overall, the chart reads as a volatile bear trend with a mid-cycle bounce attempt: short-term pressure is still dominant, the monthly context has improved, and the yearly backdrop remains negative.
Chart Analysis ATS AI Generated: 2026-07-06 07:03 for Informational use only, not trading advice. Terms and Risk Disclosure Copyright © 2026. Algo Trading Systems LLC.