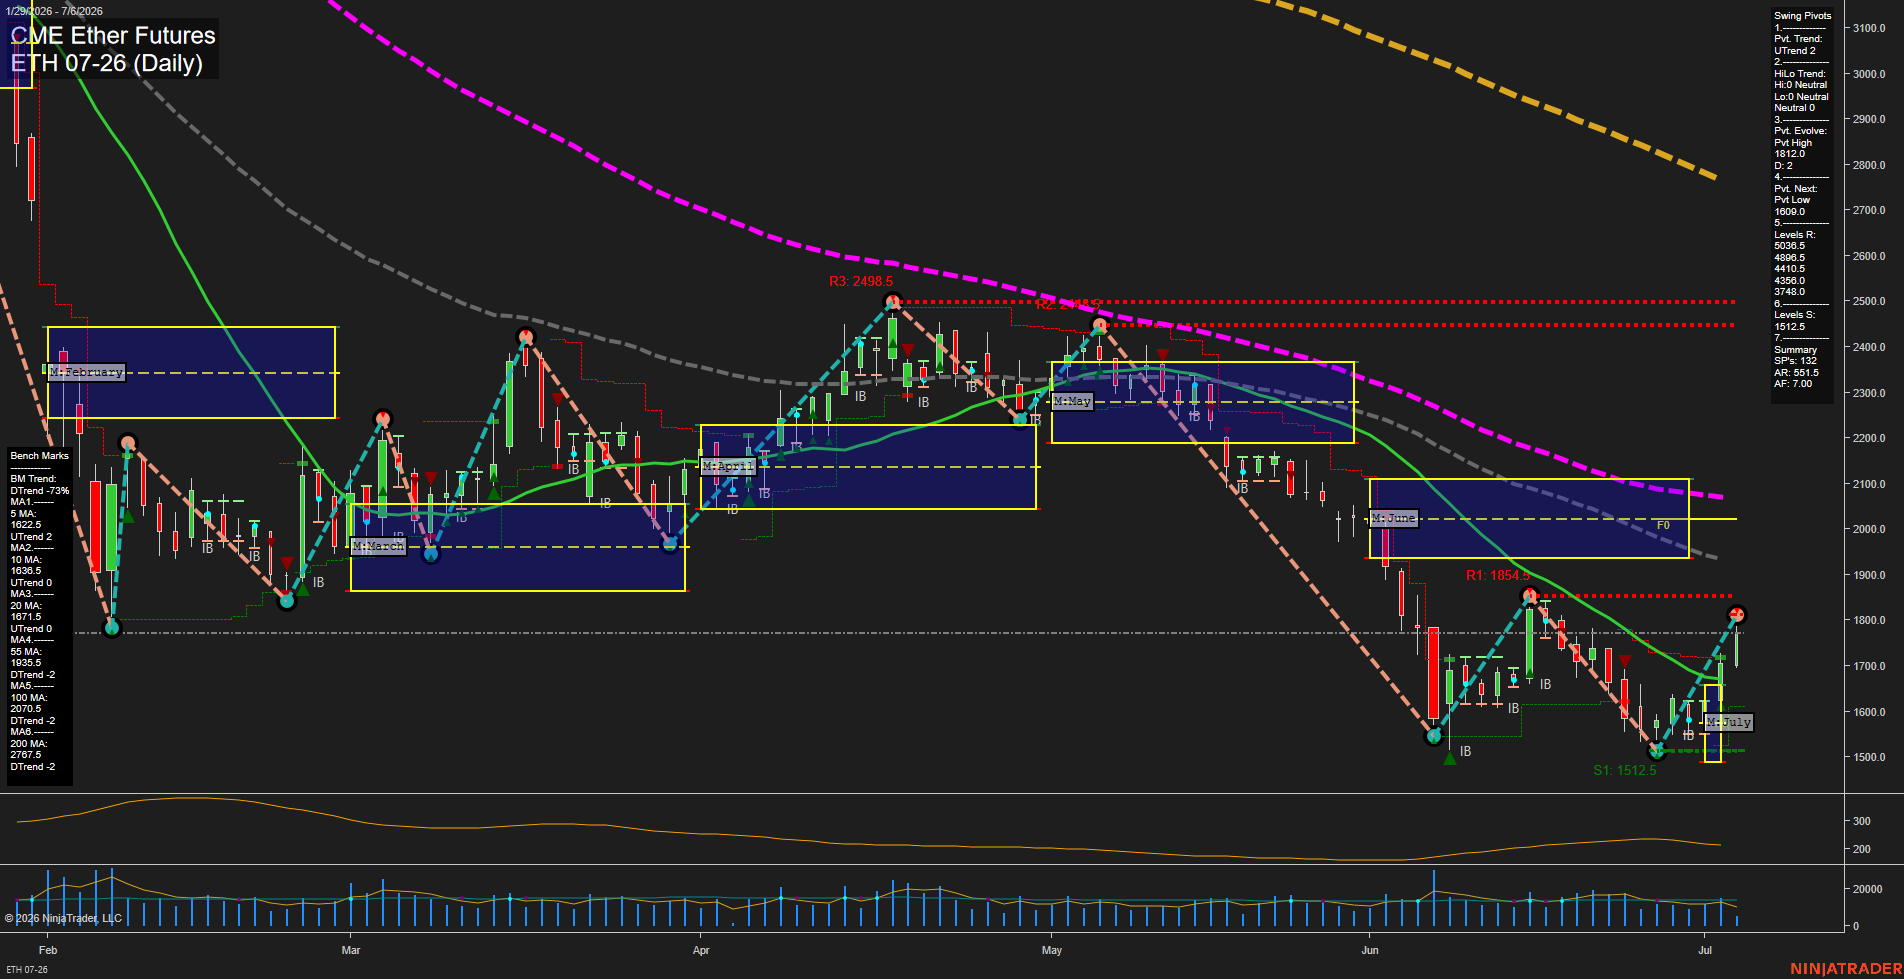
ETH CME Ether Futures Daily Chart Analysis: 2026-Jul-06 07:02 CT
Price Action
- Last: 1797.5,
- Bars: Large,
- Mom: fast.
WSFG Weekly
- Short-Term
- WSFG Current: -4%
- F0%/NTZ' Bias: Price Below,
- WSFG Trend: Down.
MSFG Month Jul
- Intermediate-Term
- MSFG Current: 35%
- F0%/NTZ' Bias: Price Above,
- MSFG Trend: Up.
YSFG Year 2026
- Long-Term
- YSFG Current: -48%
- F0%/NTZ' Bias: Price Below,
- YSFG Trend: Down.
Swing Pivots
- (Short-Term) 1. Pvt. Trend: UTrend,
- (Intermediate-Term) 2. HiLo Trend: Neutral,
- 3. Pvt. Evolve: Pvt High 1812.0,
- 4. Pvt. Next: Pvt Low 1609.0,
- 5. Levels R: 5036.5, 4896.5, 4410.5, 4356.0, 3748.0,
- 6. Levels S: 1512.5.
Daily Benchmarks
- (Short-Term) 5 Day: 1622.5 Up Trend,
- (Short-Term) 10 Day: 1636.5 Up Trend,
- (Intermediate-Term) 20 Day: 1671.5 Up Trend,
- (Intermediate-Term) 55 Day: 1935.5 Down Trend,
- (Long-Term) 100 Day: 2070.5 Down Trend,
- (Long-Term) 200 Day: 2767.5 Down Trend.
Additional Metrics
Recent Trade Signals
- 06 Jul 2026: Long ETH 07-26 @ 1797.5 Signals.USAR-WSFG
- 02 Jul 2026: Long ETH 07-26 @ 1644.5 Signals.USAR-MSFG
- 01 Jul 2026: Long ETH 07-26 @ 1625.5 Signals.USAR.TR120
Overall Rating
- Short-Term: Bearish,
- Intermediate-Term: Neutral,
- Long-Term: Bearish.
Key Insights Summary
Price is attempting a rebound from the early-July selloff, but the daily structure remains split: short-term pivot tone has turned up, while weekly session positioning is still below F0 and the higher-timeframe year grid remains negative. The fast momentum and large daily bars reflect a volatile, impulsive tape rather than a balanced consolidation. The 5, 10, and 20-day benchmarks sit below price and have turned up, supporting the current bounce, but the 55, 100, and 200-day benchmarks remain well overhead and still slope down, keeping the broader trend pressure bearish. Swing structure shows a recent pivot high at 1812.0 with the next lower pivot reference at 1609.0, while the larger resistance ladder stays far above current trade. The pattern is consistent with a counter-trend recovery inside a larger downtrend, with intraday and daily swings reacting sharply around the monthly session grid and recent IB-style compression/expansion behavior.
Chart Analysis ATS AI Generated: 2026-07-06 07:03 for Informational use only, not trading advice. Terms and Risk Disclosure Copyright © 2026. Algo Trading Systems LLC.