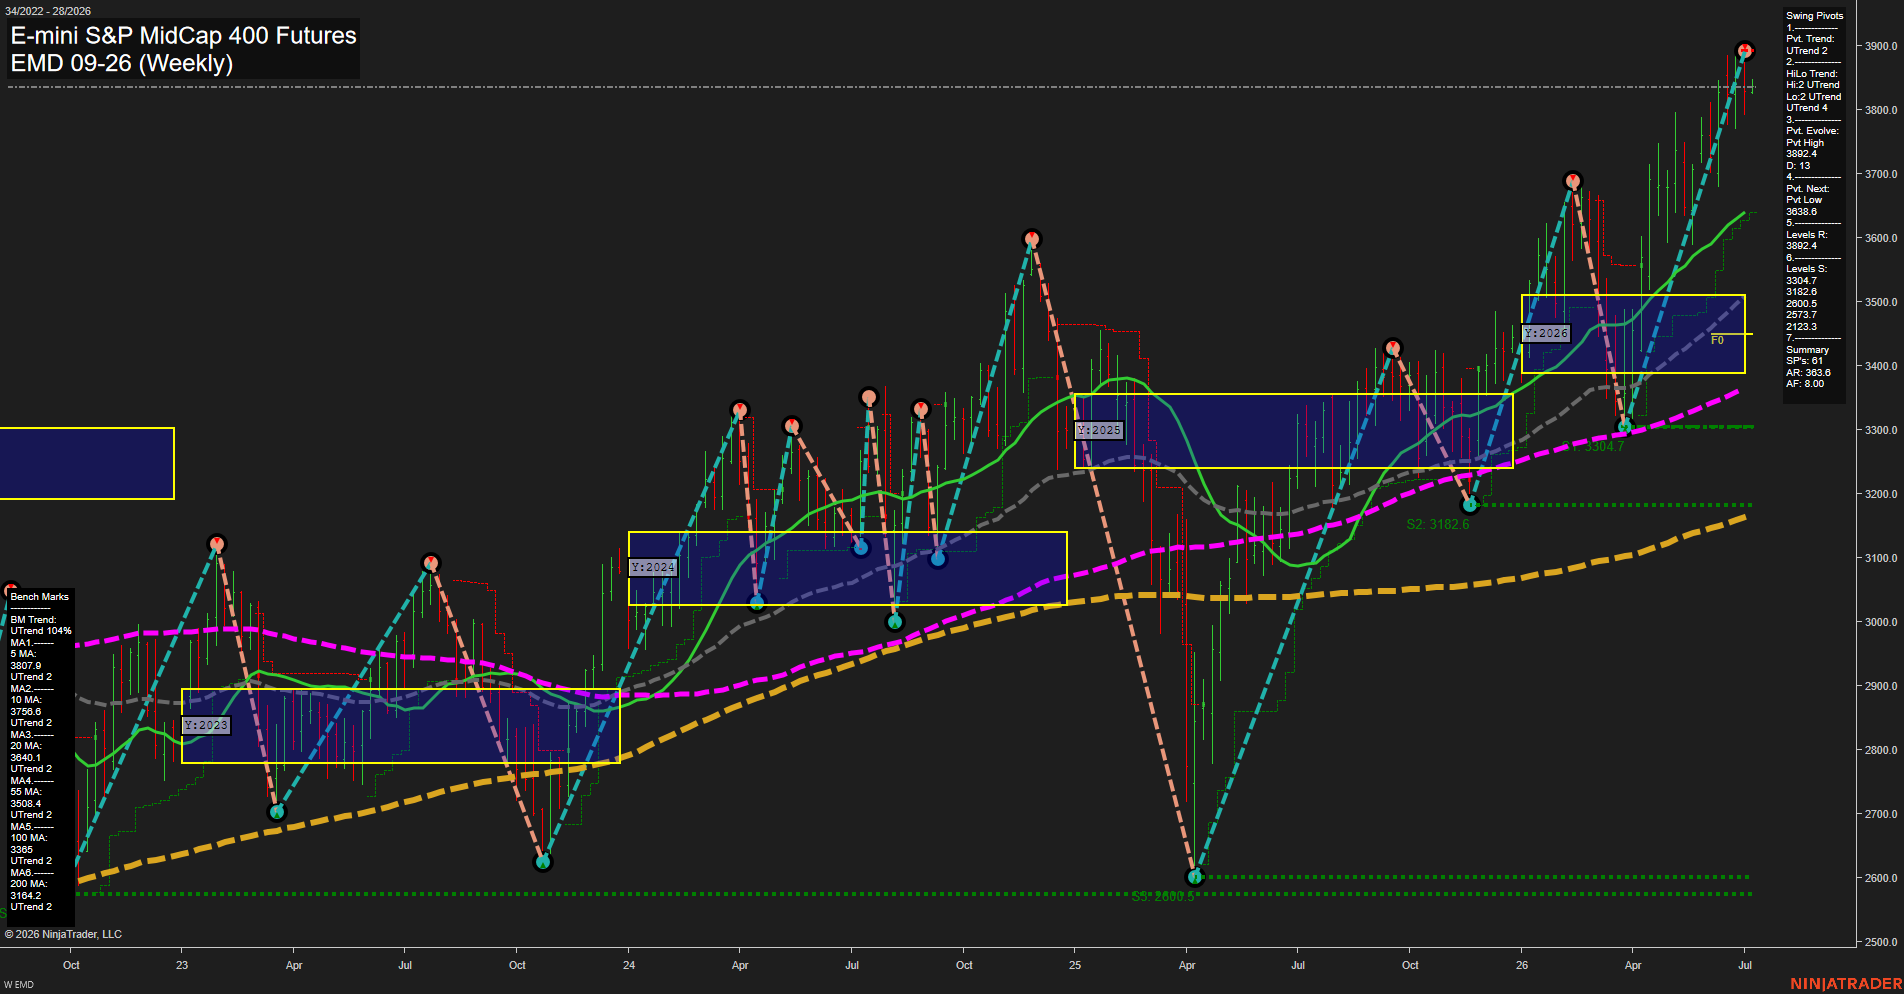
EMD E-mini S&P MidCap 400 Futures Weekly Chart Analysis: 2026-Jul-06 07:02 CT
Price Action
- Last: 3892.4,
- Bars: Large,
- Mom: fast.
WSFG Weekly
- Short-Term
- WSFG Current: 6%
- F0%/NTZ' Bias: Price Above,
- WSFG Trend: Up.
MSFG Month Jul
- Intermediate-Term
- MSFG Current: -15%
- F0%/NTZ' Bias: Price Below,
- MSFG Trend: Down.
YSFG Year 2026
- Long-Term
- YSFG Current: 63%
- F0%/NTZ' Bias: Price Above,
- YSFG Trend: Up.
Swing Pivots
- (Short-Term) 1. Pvt. Trend: UTrend,
- (Intermediate-Term) 2. HiLo Trend: UTrend,
- 3. Pvt. Evolve: Pvt High 3892.4,
- 4. Pvt. Next: Pvt Low 3638.6,
- 5. Levels R: 3892.4,
- 6. Levels S: 3304.7, 3182.6, 2800.5, 2573.7, 2123.3.
Weekly Benchmarks
- (Short-Term) 5 Day: 3807.9 Up Trend,
- (Short-Term) 10 Day: 3756.8 Up Trend,
- (Intermediate-Term) 20 Day: 3640.1 Up Trend,
- (Intermediate-Term) 55 Day: 3508.4 Up Trend,
- (Long-Term) 100 Day: 3385.0 Up Trend,
- (Long-Term) 200 Day: 3164.2 Up Trend.
Recent Trade Signals
- 02 Jul 2026: Short EMD 09-26 @ 3829 Signals.USAR-MSFG
Overall Rating
- Short-Term: Bullish,
- Intermediate-Term: Bearish,
- Long-Term: Bullish.
Key Insights Summary
Price is pressing into fresh weekly highs with large candles and fast upside momentum, keeping the short-term structure firmly constructive. The weekly session fib grid is above its midpoint, the pivot trend is up, and price remains well above the 5, 10, 20, 55, 100, and 200 day benchmarks, which confirms a strong underlying trend across the broader swing timeframe. The yearly fib grid is also positive, showing that the larger 2026 advance remains intact. In contrast, the monthly July grid is still below its midpoint, reflecting that the current month sits in a pullback phase within the larger uptrend. Overall, the chart shows a strong bullish trend with a mixed intermediate backdrop and a dominant long-term upward structure.
Chart Analysis ATS AI Generated: 2026-07-06 07:02 for Informational use only, not trading advice. Terms and Risk Disclosure Copyright © 2026. Algo Trading Systems LLC.