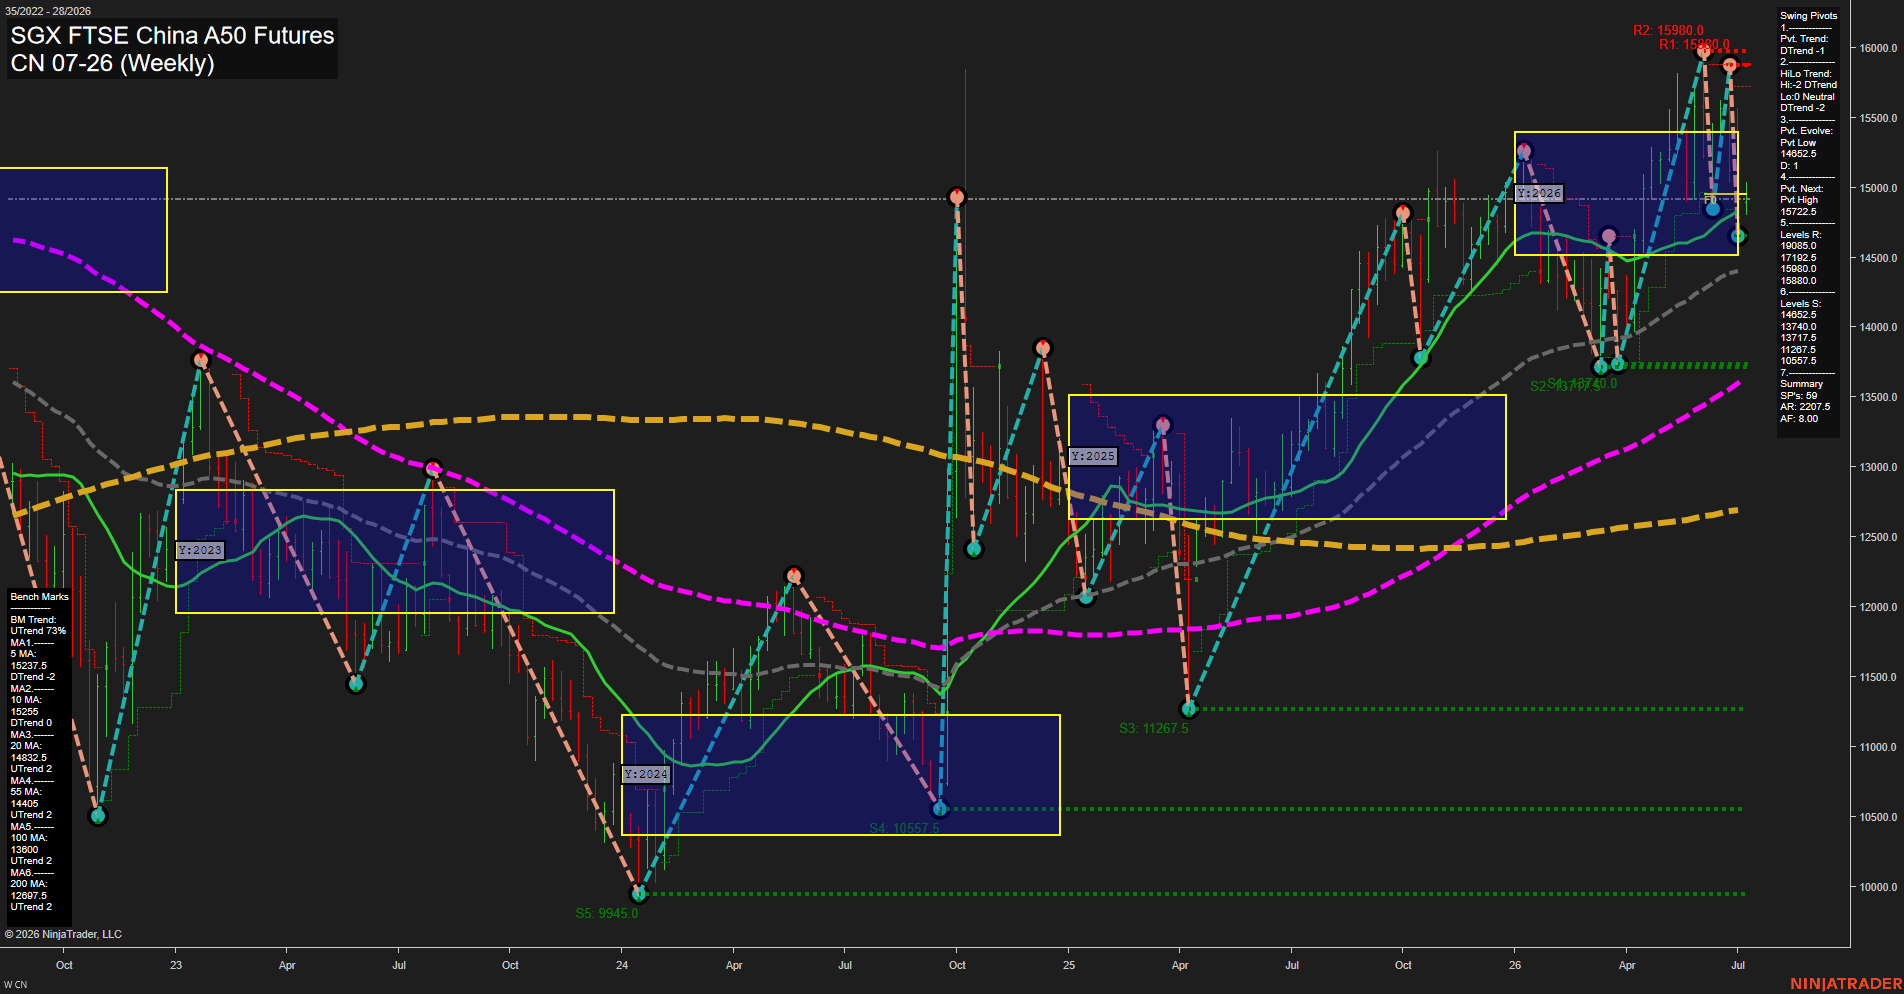
CN SGX FTSE China A50 Futures Weekly Chart Analysis: 2026-Jul-06 07:02 CT
Price Action
- Last: 14900.0,
- Bars: Large,
- Mom: fast.
WSFG Weekly
- Short-Term
- WSFG Current: NA%
- F0%/NTZ' Bias: Price Neutral,
- WSFG Trend: Neutral.
MSFG Month Jul
- Intermediate-Term
- MSFG Current: NA%
- F0%/NTZ' Bias: Price Neutral,
- MSFG Trend: Neutral.
YSFG Year 2026
- Long-Term
- YSFG Current: NA%
- F0%/NTZ' Bias: Price Neutral,
- YSFG Trend: Neutral.
Swing Pivots
- (Short-Term) 1. Pvt. Trend: DTrend,
- (Intermediate-Term) 2. HiLo Trend: DTrend,
- 3. Pvt. Evolve: Pvt Low 14652.5,
- 4. Pvt. Next: Pvt High 15722.5,
- 5. Levels R: 19085.0, 17192.5, 15980.0, 15880.0,
- 6. Levels S: 14652.5, 13740.0, 13717.5, 11287.5, 10557.5.
Weekly Benchmarks
- (Short-Term) 5 Day: 15237.5 Down Trend,
- (Short-Term) 10 Day: 15225 Down Trend,
- (Intermediate-Term) 20 Day: 14832.5 Up Trend,
- (Intermediate-Term) 55 Day: 14405 Up Trend,
- (Long-Term) 100 Day: 13600 Up Trend,
- (Long-Term) 200 Day: 12807.5 Up Trend.
Overall Rating
- Short-Term: Bearish,
- Intermediate-Term: Bullish,
- Long-Term: Bullish.
Key Insights Summary
The weekly structure remains in a broad uptrend sequence from the 2024 base, but the most recent pivot action has rolled into a short-term DTrend with price trading back below the recent swing highs and working through a consolidation zone near the upper Yearly Session Fib region. The 20-day and longer benchmarks remain stacked in bullish alignment, which keeps the intermediate and long-term backdrop constructive, while the 5-day and 10-day benchmarks have turned lower and reflect near-term pressure. The pivot map shows nearby resistance clustered at 15,880 to 15,980, with deeper overhead levels at 17,192.5 and 19,085, while support is first defined at 14,652.5 and then 13,740 to 13,717.5. From a swing trader viewpoint, this is a market that has already produced a strong recovery leg and is now digesting gains with choppy weekly rotation, higher volatility, and a potential transition from impulse up into a pullback or sideways phase.
Chart Analysis ATS AI Generated: 2026-07-06 07:02 for Informational use only, not trading advice. Terms and Risk Disclosure Copyright © 2026. Algo Trading Systems LLC.