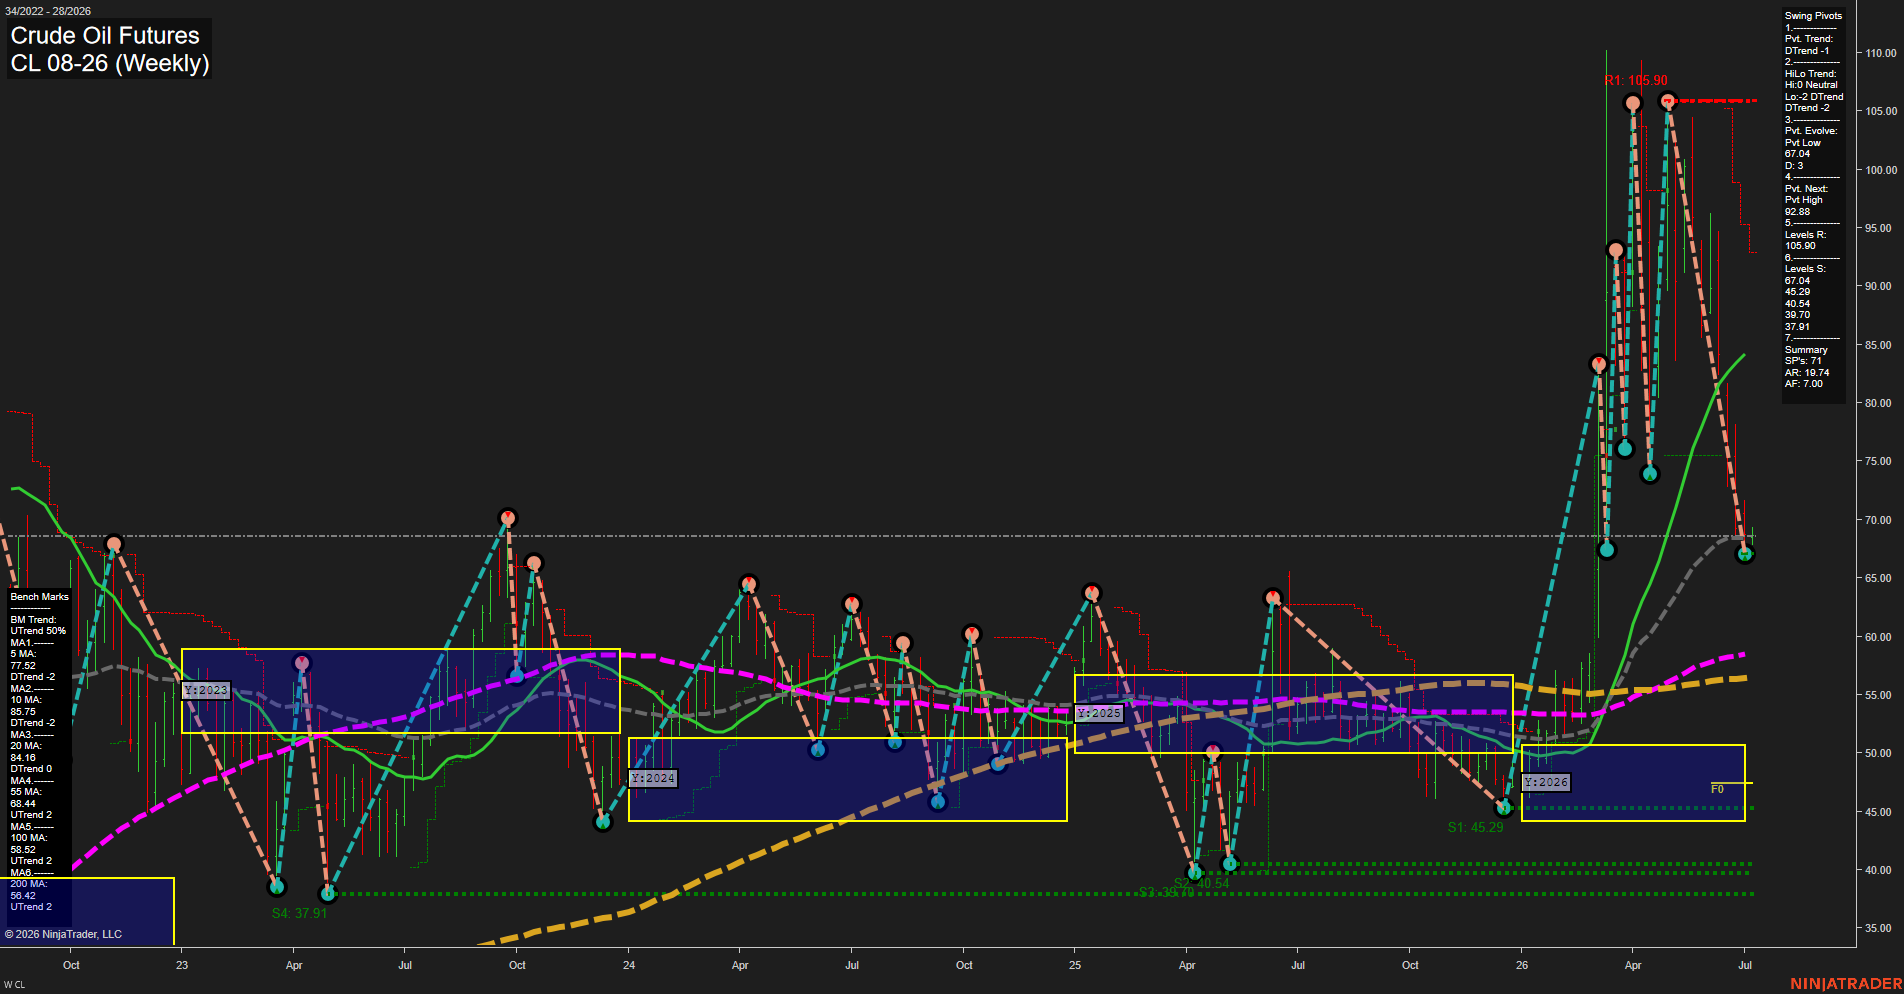
CL Crude Oil Futures Weekly Chart Analysis: 2026-Jul-06 07:01 CT
Price Action
- Last: 67.04,
- Bars: Large,
- Mom: Fast.
WSFG Weekly
- Short-Term
- WSFG Current: 0%
- F0%/NTZ' Bias: Price Neutral,
- WSFG Trend: Neutral.
MSFG Month Jul
- Intermediate-Term
- MSFG Current: -4%
- F0%/NTZ' Bias: Price Below,
- MSFG Trend: Down.
YSFG Year 2026
- Long-Term
- YSFG Current: 65%
- F0%/NTZ' Bias: Price Above,
- YSFG Trend: Up.
Swing Pivots
- (Short-Term) 1. Pvt. Trend: DTrend,
- (Intermediate-Term) 2. HiLo Trend: DTrend,
- 3. Pvt. Evolve: Pvt Low 67.04,
- 4. Pvt. Next: Pvt High 92.88,
- 5. Levels R: 105.90,
- 6. Levels S: 67.04, 45.29, 40.54, 39.70, 37.91.
Weekly Benchmarks
- (Short-Term) 5 Day: 77.52 Down Trend,
- (Short-Term) 10 Day: 85.76 Down Trend,
- (Intermediate-Term) 20 Day: 84.16 Down Trend,
- (Intermediate-Term) 55 Day: 68.44 Up Trend,
- (Long-Term) 100 Day: 58.52 Up Trend,
- (Long-Term) 200 Day: 56.42 Up Trend.
Recent Trade Signals
- 03 Jul 2026: Long CL 08-26 @ 69.2 Signals.USAR.TR120
- 01 Jul 2026: Short CL 08-26 @ 69.36 Signals.USAR-WSFG
Overall Rating
- Short-Term: Bearish,
- Intermediate-Term: Bearish,
- Long-Term: Bullish.
Key Insights Summary
Weekly crude oil is coming off a very large volatility expansion from the 2026 peak near 105.90 down into the 67.04 area, leaving the short-term structure in a clear corrective down swing. The weekly pivot trend and recent price action both point lower, while the WSFG remains neutral at the center of its range, showing the market is digesting the prior impulse rather than trending cleanly on the week-to-week grid. The monthly session grid is below its midpoint and aligned with a down bias, reinforcing the intermediate-term pullback. The yearly grid still holds an above-midpoint reading and the longer moving averages remain upward sloping, so the broader tape is still constructive despite the sharp retracement. The chart is showing a failed extension from the highs, a steep reversal, and now a test back into the lower part of the 2026 range with key support layered beneath current price.
Chart Analysis ATS AI Generated: 2026-07-06 07:01 for Informational use only, not trading advice. Terms and Risk Disclosure Copyright © 2026. Algo Trading Systems LLC.