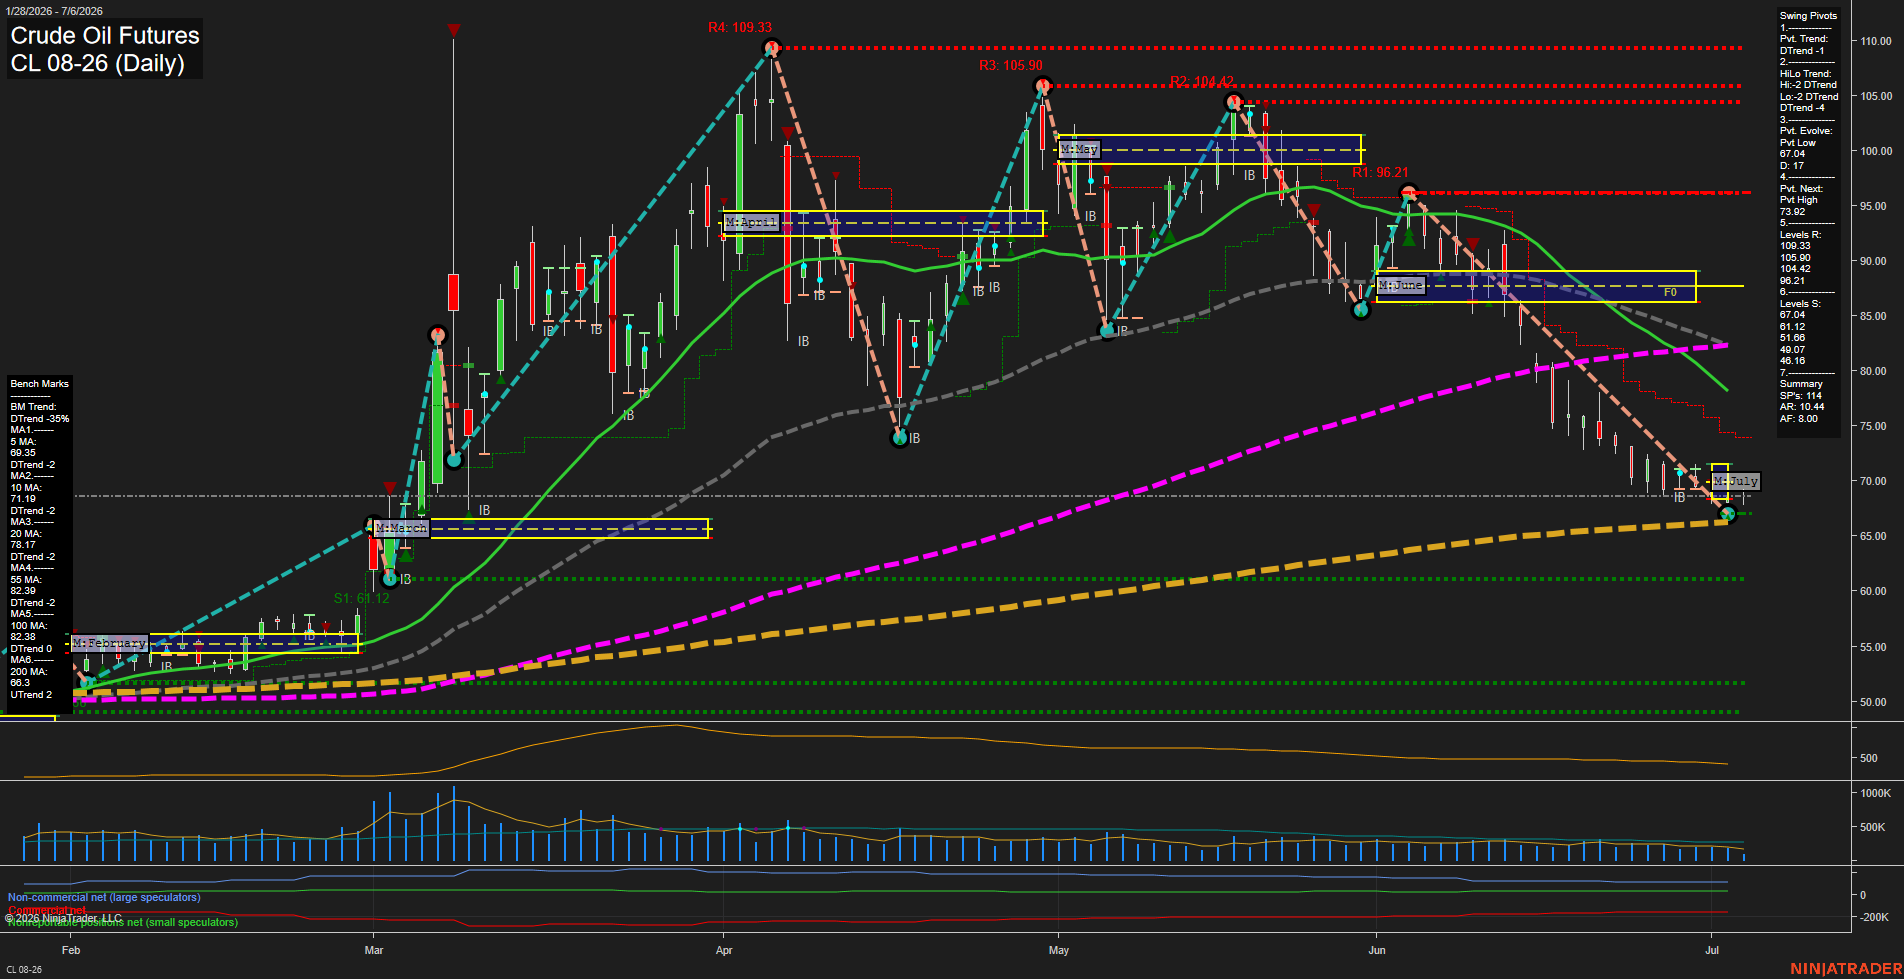
CL Crude Oil Futures Daily Chart Analysis: 2026-Jul-06 07:01 CT
Price Action
- Last: 67.04,
- Bars: Small,
- Mom: Slow.
WSFG Weekly
- Short-Term
- WSFG Current: 0%
- F0%/NTZ' Bias: Price Neutral,
- WSFG Trend: Neutral.
MSFG Month Jul
- Intermediate-Term
- MSFG Current: -4%
- F0%/NTZ' Bias: Price Below,
- MSFG Trend: Down.
YSFG Year 2026
- Long-Term
- YSFG Current: 65%
- F0%/NTZ' Bias: Price Above,
- YSFG Trend: Up.
Swing Pivots
- (Short-Term) 1. Pvt. Trend: DTrend,
- (Intermediate-Term) 2. HiLo Trend: DTrend,
- 3. Pvt. Evolve: Pvt Low 67.04,
- 4. Pvt. Next: Pvt High 73.92,
- 5. Levels R: 109.33, 105.90, 104.42, 96.21,
- 6. Levels S: 67.04, 61.12, 51.66, 49.07, 48.16.
Daily Benchmarks
- (Short-Term) 5 Day: 69.36 Down Trend,
- (Short-Term) 10 Day: 71.19 Down Trend,
- (Intermediate-Term) 20 Day: 78.17 Down Trend,
- (Intermediate-Term) 55 Day: 82.39 Down Trend,
- (Long-Term) 100 Day: 82.83 Down Trend,
- (Long-Term) 200 Day: 68.30 Up Trend.
Additional Metrics
- ATR: 10.44,
- VOLMA: 345883.
Recent Trade Signals
- 03 Jul 2026: Long CL 08-26 @ 69.2 Signals.USAR.TR120
- 01 Jul 2026: Short CL 08-26 @ 69.36 Signals.USAR-WSFG
Overall Rating
- Short-Term: Bearish,
- Intermediate-Term: Bearish,
- Long-Term: Bearish.
Key Insights Summary
Crude oil is pressing into the lower end of the yearly range with the daily structure still dominated by a clear downtrend of lower highs and lower lows. The latest swing pivot is a confirmed pivot low at 67.04, with the next reference pivot high sitting at 73.92, showing the market is still operating inside a declining swing sequence. Price is below the monthly F0%/NTZ zone for July, matching the negative MSFG reading and reinforcing the intermediate-term bearish bias. The daily benchmark stack is also heavy, with price below the 5, 10, 20, 55, and 100 day averages, while the 200 day sits just above price and acts as the closest long-term reference. Recent candles show contraction and smaller bars after the sharp decline, suggesting a pause near support rather than a confirmed reversal. Overall, the chart reflects a bearish daily trend with a possible stabilization phase around the mid-60s after the steep June selloff.
Chart Analysis ATS AI Generated: 2026-07-06 07:01 for Informational use only, not trading advice. Terms and Risk Disclosure Copyright © 2026. Algo Trading Systems LLC.