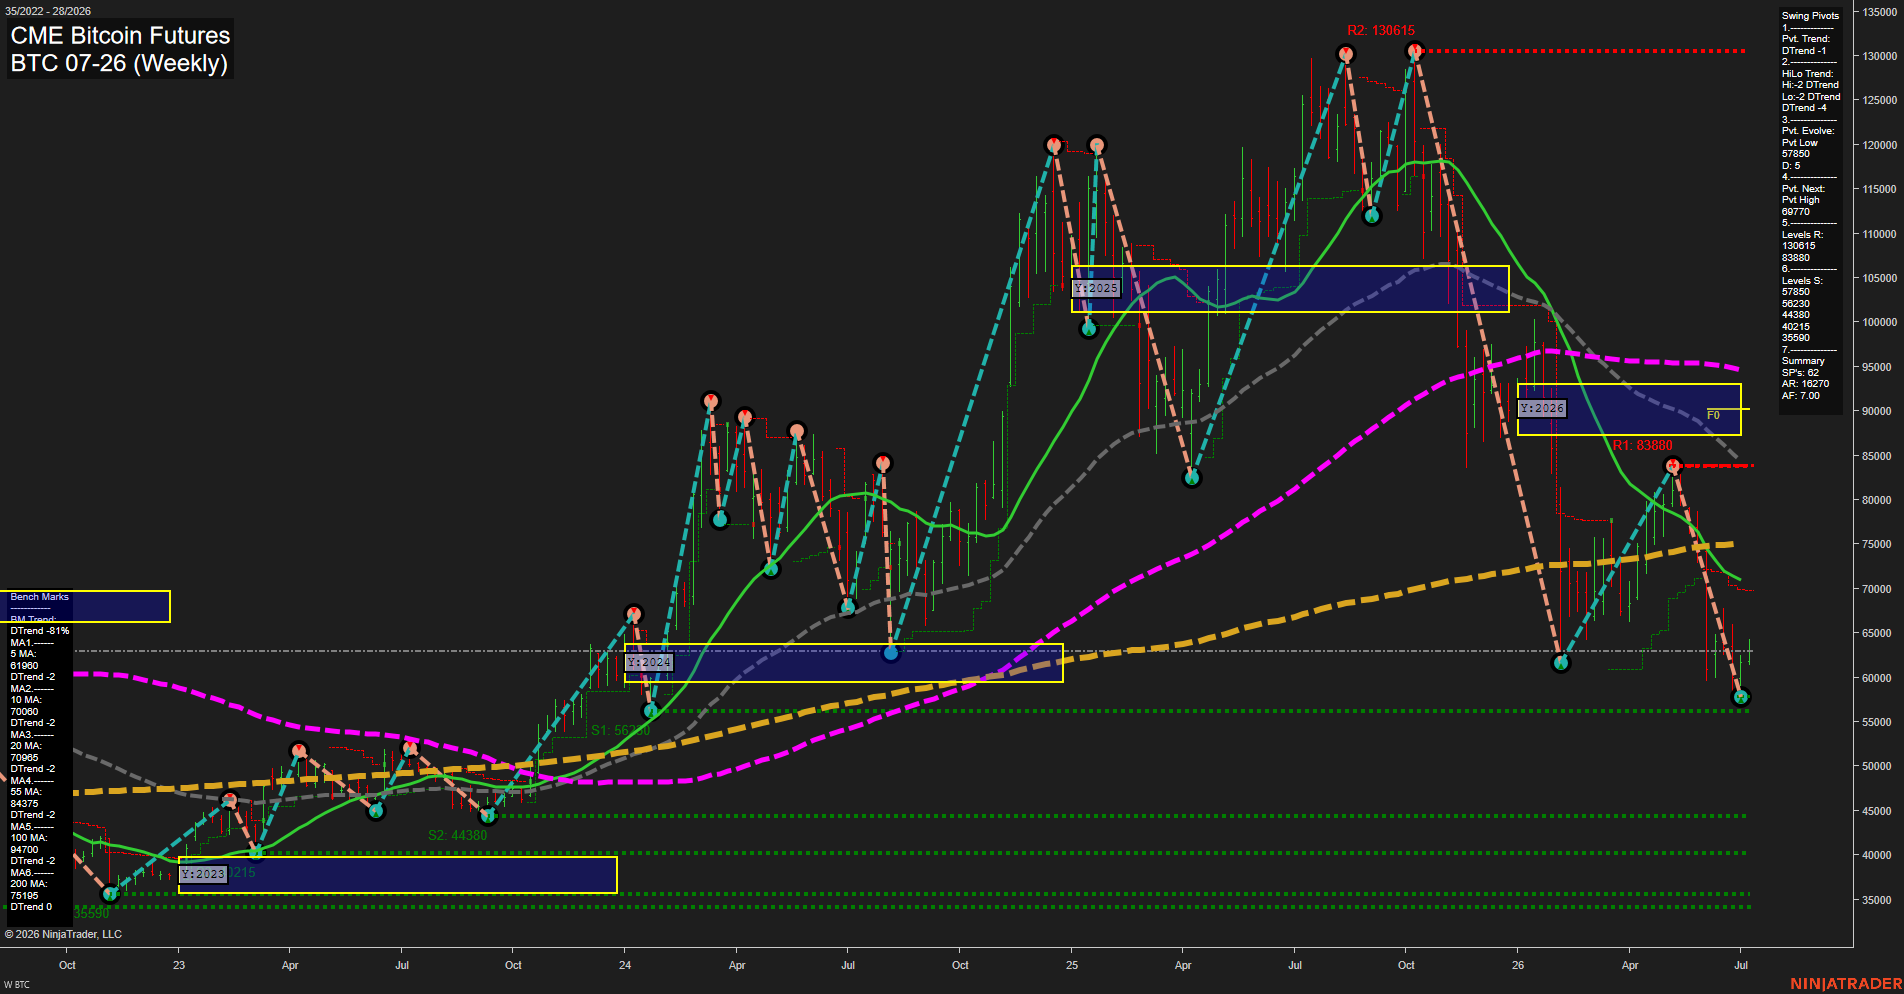
BTC CME Bitcoin Futures Weekly Chart Analysis: 2026-Jul-06 07:01 CT
Price Action
- Last: 64100,
- Bars: Large,
- Mom: fast.
WSFG Weekly
- Short-Term
- WSFG Current: -9%
- F0%/NTZ' Bias: Price Below,
- WSFG Trend: Down.
MSFG Month Jul
- Intermediate-Term
- MSFG Current: 25%
- F0%/NTZ' Bias: Price Above,
- MSFG Trend: Up.
YSFG Year 2026
- Long-Term
- YSFG Current: -96%
- F0%/NTZ' Bias: Price Below,
- YSFG Trend: Down.
Swing Pivots
- (Short-Term) 1. Pvt. Trend: DTrend,
- (Intermediate-Term) 2. HiLo Trend: DTrend,
- 3. Pvt. Evolve: Pvt Low 57850,
- 4. Pvt. Next: Pvt High 69770,
- 5. Levels R: 130615, 83880,
- 6. Levels S: 57850, 56230, 44380, 40215, 35590.
Weekly Benchmarks
- (Short-Term) 5 Day: 61980 Down Trend,
- (Short-Term) 10 Day: 70080 Down Trend,
- (Intermediate-Term) 20 Day: 70985 Down Trend,
- (Intermediate-Term) 55 Day: 84375 Down Trend,
- (Long-Term) 100 Day: 94700 Down Trend,
- (Long-Term) 200 Day: 75105 Down Trend.
Recent Trade Signals
- 05 Jul 2026: Long BTC 07-26 @ 64000 Signals.USAR-WSFG
- 02 Jul 2026: Long BTC 07-26 @ 61265 Signals.USAR-MSFG
- 01 Jul 2026: Long BTC 07-26 @ 60350 Signals.USAR.TR120
Overall Rating
- Short-Term: Bearish,
- Intermediate-Term: Bullish,
- Long-Term: Bearish.
Key Insights Summary
BTC futures are trading in a sharp weekly downswing after failing near the upper YSFG/weekly resistance region, with price now pressed back below the weekly fib midpoint and sitting near the 5-day benchmark. Short-term structure remains DTrend with lower highs and lower lows, while the next pivot framework still points to a pending upside pivot only if price can reclaim the mid-60s to upper-60s zone. Intermediate-term structure is still constructive because July MSFG remains above F0% and the recent trade signal stack from early July is aligned to the upside, but the weekly tape has turned heavy and momentum is accelerating lower. Long-term context remains bearish because price is well below the 2026 yearly NTZ and the 100-day/200-day benchmark zone is still overhead, leaving the broader trend capped by declining weekly benchmarks and unresolved overhead supply from prior swing highs.
Chart Analysis ATS AI Generated: 2026-07-06 07:01 for Informational use only, not trading advice. Terms and Risk Disclosure Copyright © 2026. Algo Trading Systems LLC.