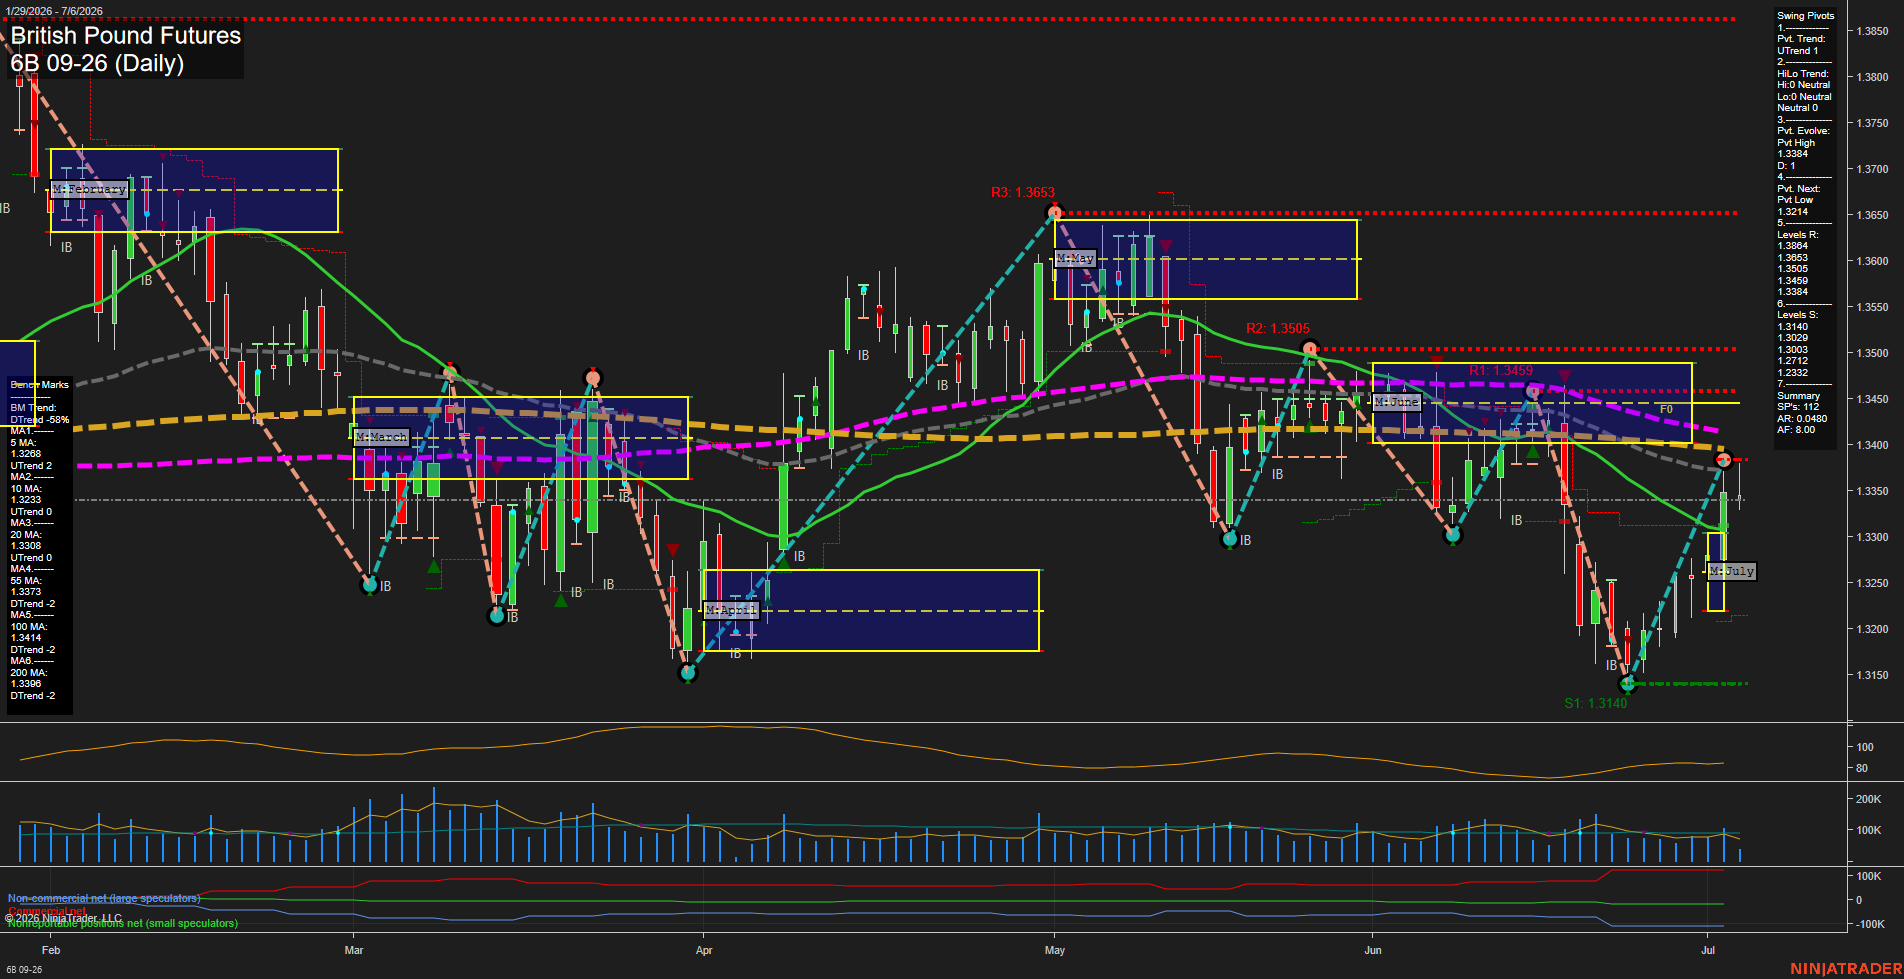
6B British Pound Futures Daily Chart Analysis: 2026-Jul-06 07:00 CT
Price Action
- Last: 1.3380,
- Bars: Medium,
- Mom: Average.
WSFG Weekly
- Short-Term
- WSFG Current: -5%
- F0%/NTZ' Bias: Price Below,
- WSFG Trend: Down.
MSFG Month Jul
- Intermediate-Term
- MSFG Current: 30%
- F0%/NTZ' Bias: Price Above,
- MSFG Trend: Up.
YSFG Year 2026
- Long-Term
- YSFG Current: -8%
- F0%/NTZ' Bias: Price Below,
- YSFG Trend: Down.
Swing Pivots
- (Short-Term) 1. Pvt. Trend: UTrend,
- (Intermediate-Term) 2. HiLo Trend: Neutral,
- 3. Pvt. Evolve: Pvt High 1.3384,
- 4. Pvt. Next: Pvt Low 1.3214,
- 5. Levels R: 1.3864, 1.3653, 1.3505, 1.3459, 1.3384,
- 6. Levels S: 1.3140, 1.3029, 1.3003, 1.2712.
Daily Benchmarks
- (Short-Term) 5 Day: 1.3268 Up Trend,
- (Short-Term) 10 Day: 1.3233 Up Trend,
- (Intermediate-Term) 20 Day: 1.3308 Up Trend,
- (Intermediate-Term) 55 Day: 1.3373 Down Trend,
- (Long-Term) 100 Day: 1.3414 Down Trend,
- (Long-Term) 200 Day: 1.3396 Down Trend.
Additional Metrics
Recent Trade Signals
- 02 Jul 2026: Long 6B 09-26 @ 1.3361 Signals.USAR.TR720
- 02 Jul 2026: Long 6B 09-26 @ 1.3291 Signals.USAR-MSFG
- 30 Jun 2026: Long 6B 09-26 @ 1.3237 Signals.USAR-WSFG
Overall Rating
- Short-Term: Neutral,
- Intermediate-Term: Bearish,
- Long-Term: Bearish.
Key Insights Summary
GBP futures are rebounding from the early-July low near 1.3140 and have recovered back toward the 1.3384 pivot-high area, creating a short-term repair phase inside a broader down-move. Weekly structure remains below its NTZ/F0% reference and still reads down, while the July monthly grid is holding above its midpoint and keeps the intermediate backdrop constructive. The pivot map shows a short-term UTrend, but the broader HiLo trend is neutral and price is still working beneath the 55/100/200-day benchmarks, which keeps the higher-timeframe tone bearish. The market is now sitting between nearby resistance at 1.3384, 1.3459, and 1.3505, with the larger supply zone up toward 1.3653 and 1.3864, while support is layered at 1.3214 and then 1.3140. Recent long signals on TR720, MSFG, and WSFG align with the recovery attempt, but the chart still looks like a counter-trend bounce within a larger downward sequence rather than a full trend reversal.
Chart Analysis ATS AI Generated: 2026-07-06 07:00 for Informational use only, not trading advice. Terms and Risk Disclosure Copyright © 2026. Algo Trading Systems LLC.