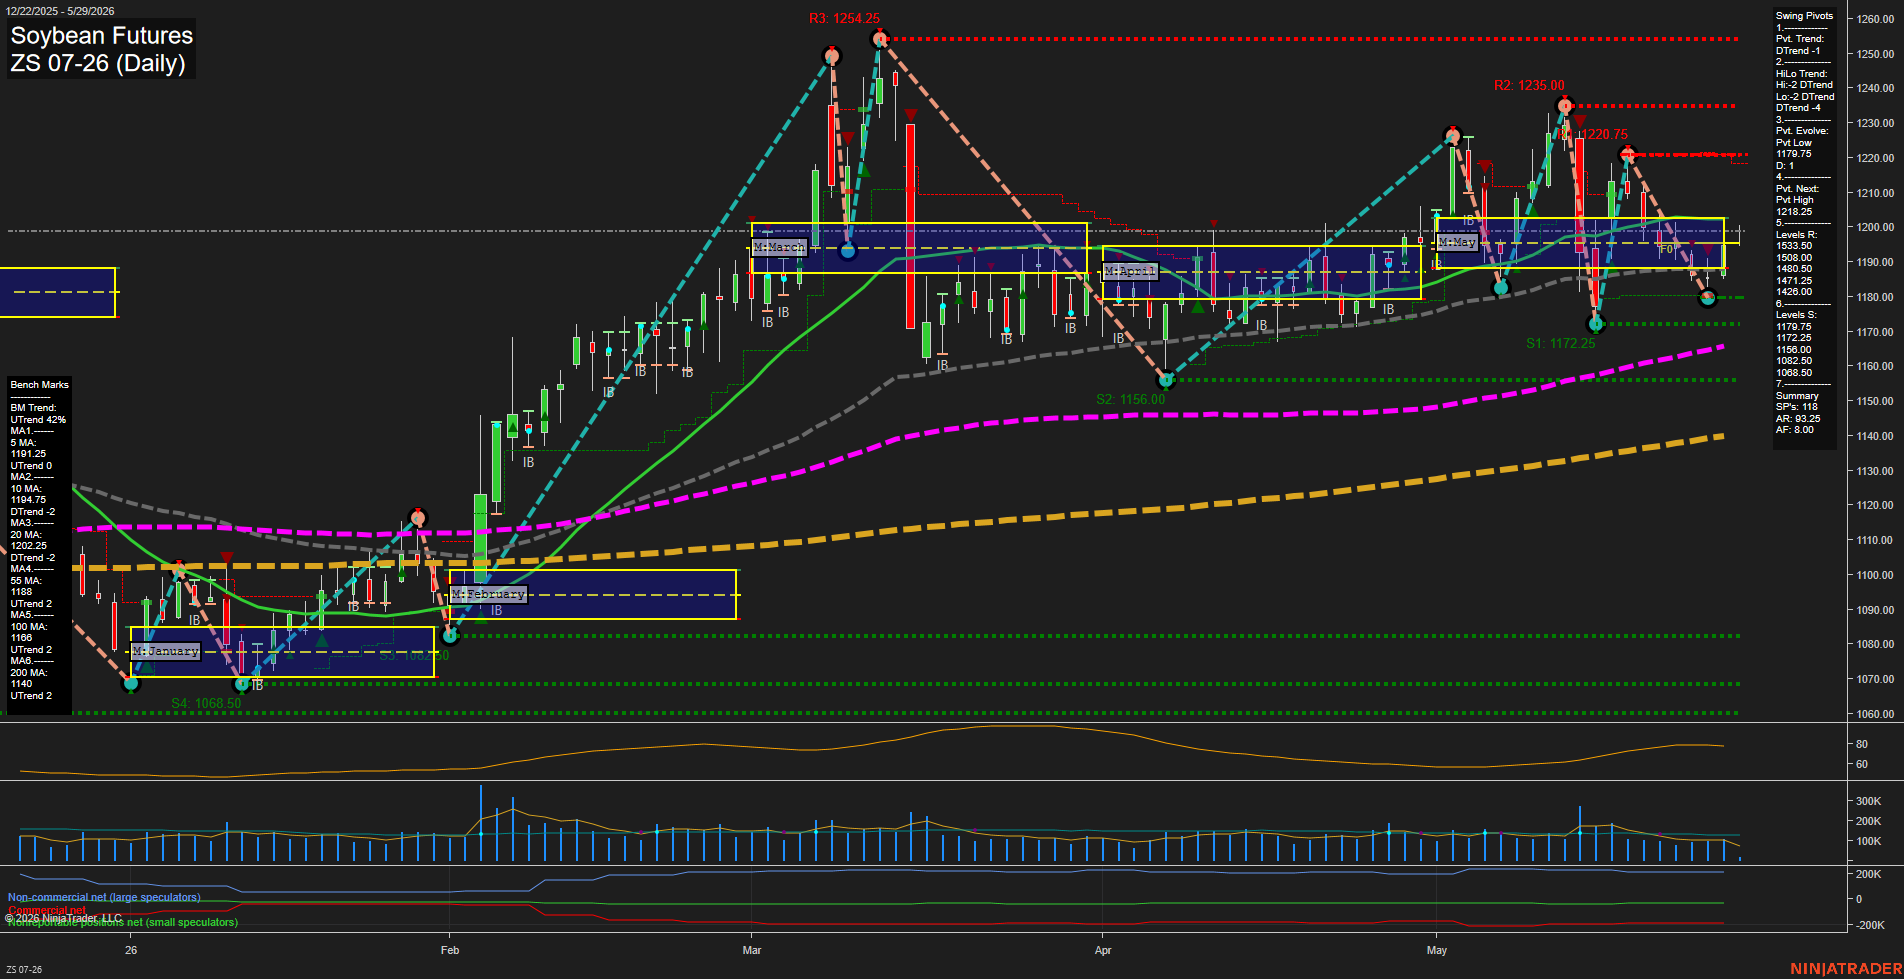
ZS Soybean Futures Daily Chart Analysis: 2026-May-29 07:09 CT
Price Action
- Last: 1198.25,
- Bars: Large,
- Mom: Average.
WSFG Weekly
- Short-Term
- WSFG Current: 16%
- F0%/NTZ' Bias: Price Above,
- WSFG Trend: Up.
MSFG Month May
- Intermediate-Term
- MSFG Current: -7%
- F0%/NTZ' Bias: Price Below,
- MSFG Trend: Down.
YSFG Year 2026
- Long-Term
- YSFG Current: 30%
- F0%/NTZ' Bias: Price Above,
- YSFG Trend: Up.
Swing Pivots
- (Short-Term) 1. Pvt. Trend: DTrend,
- (Intermediate-Term) 2. HiLo Trend: DTrend,
- 3. Pvt. Evolve: Pvt Low 1179.75,
- 4. Pvt. Next: Pvt High 1218.25,
- 5. Levels R: 1533.50, 1508.00, 1480.50, 1471.25, 1426.00,
- 6. Levels S: 1179.75, 1172.25, 1158.00, 1082.50, 1068.50.
Daily Benchmarks
- (Short-Term) 5 Day: 1191.25 Up Trend,
- (Short-Term) 10 Day: 1194.75 Down Trend,
- (Intermediate-Term) 20 Day: 1202.25 Down Trend,
- (Intermediate-Term) 55 Day: 1188.00 Up Trend,
- (Long-Term) 100 Day: 1168.00 Up Trend,
- (Long-Term) 200 Day: 1140.00 Up Trend.
Additional Metrics
Recent Trade Signals
- 29 May 2026: Long ZS 07-26 @ 1199.5 Signals.USAR-WSFG
- 28 May 2026: Short ZS 07-26 @ 1192 Signals.USAR-MSFG
Overall Rating
- Short-Term: Neutral,
- Intermediate-Term: Bearish,
- Long-Term: Bullish.
Key Insights Summary
Soybean futures are holding a mixed-to-bullish longer-term structure while the near-term swing posture remains choppy. Price is trading just above the weekly fib bias and still above the major 100- and 200-day benchmarks, which keeps the broader 2026 trend constructive. At the same time, May’s monthly session fib grid is still negative and the pivot structure is in a DTrend with a fresh lower pivot sequence, showing that the market is still working through a corrective phase beneath the recent highs. The daily tape has been rotating between inside-bar consolidation and sharp expansion swings, with repeated tests of the 1179.75 to 1218.25 zone defining the active decision area.
Chart Analysis ATS AI Generated: 2026-05-29 07:10 for Informational use only, not trading advice. Terms and Risk Disclosure Copyright © 2026. Algo Trading Systems LLC.