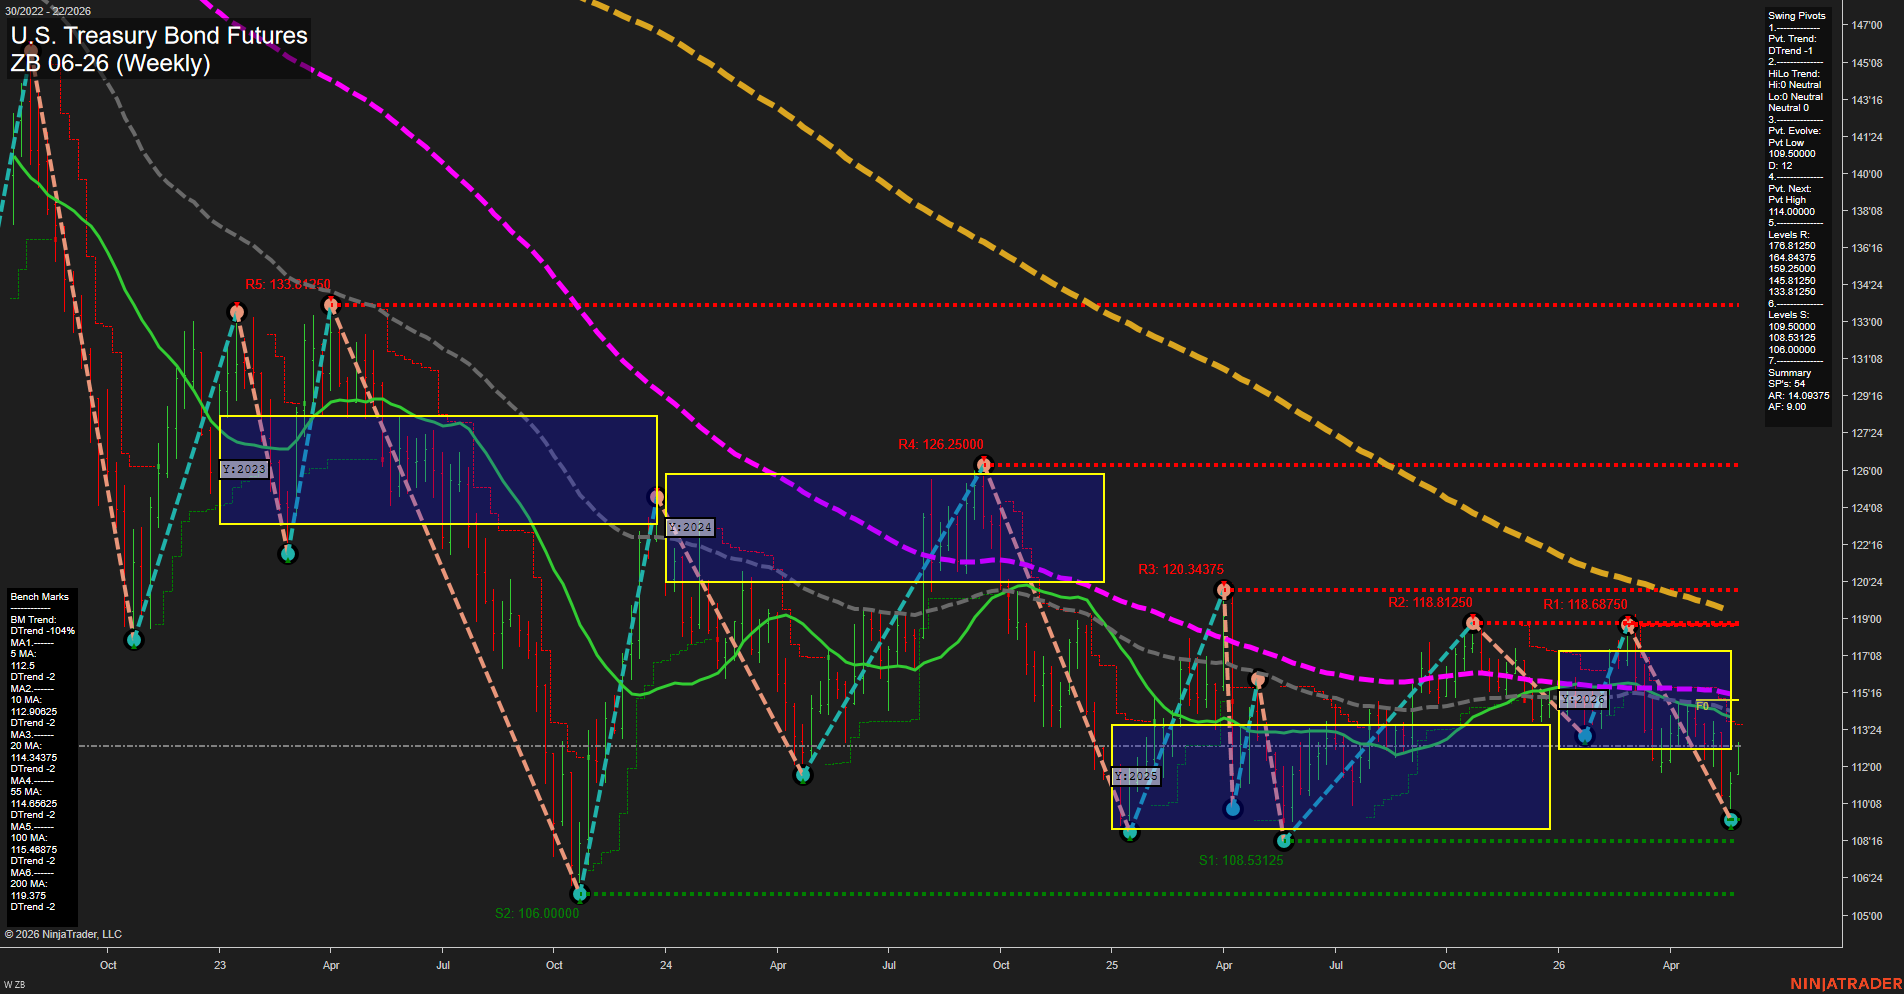
ZB U.S. Treasury Bond Futures Weekly Chart Analysis: 2026-May-29 07:09 CT
Price Action
- Last: 113'00,
- Bars: Large,
- Mom: fast.
WSFG Weekly
- Short-Term
- WSFG Current: NA%
- F0%/NTZ' Bias: Price Neutral,
- WSFG Trend: Neutral.
MSFG Month May
- Intermediate-Term
- MSFG Current: NA%
- F0%/NTZ' Bias: Price Neutral,
- MSFG Trend: Neutral.
YSFG Year 2026
- Long-Term
- YSFG Current: NA%
- F0%/NTZ' Bias: Price Neutral,
- YSFG Trend: Neutral.
Swing Pivots
- (Short-Term) 1. Pvt. Trend: DTrend,
- (Intermediate-Term) 2. HiLo Trend: UTrend,
- 3. Pvt. Evolve: Pvt Low 109.50000,
- 4. Pvt. Next: Pvt High 114.00000,
- 5. Levels R: 176.81250, 164.84375, 159.25000, 145.81250, 133.81250,
- 6. Levels S: 109.50000, 108.53125, 106.00000.
Weekly Benchmarks
- (Short-Term) 5 Day: 112.50000 Down Trend,
- (Short-Term) 10 Day: 112.90625 Down Trend,
- (Intermediate-Term) 20 Day: 114.34375 Down Trend,
- (Intermediate-Term) 55 Day: 114.65625 Down Trend,
- (Long-Term) 100 Day: 115.46875 Down Trend,
- (Long-Term) 200 Day: 119.37500 Down Trend.
Overall Rating
- Short-Term: Bearish,
- Intermediate-Term: Bearish,
- Long-Term: Bearish.
Key Insights Summary
The weekly chart is trading in a mature bearish phase with price positioned below all listed benchmarks, confirming downside control across short, intermediate, and long horizons. The short-term swing pivot trend remains DTrend, while the higher-order HiLo structure is mixed-to-neutral, which reflects a market that is still working through a broader downcycle but with periodic countertrend rebounds. The latest weekly action shows a large, fast-momentum downside candle into the lower portion of the current yearly structure, aligning with the downside bias seen in the pivot sequence and moving averages. The session fib grids are neutral on the summary readout, so the primary message comes from the price structure: lower highs, lower lows, and repeated rejection from overhead resistance zones.
Chart Analysis ATS AI Generated: 2026-05-29 07:09 for Informational use only, not trading advice. Terms and Risk Disclosure Copyright © 2026. Algo Trading Systems LLC.