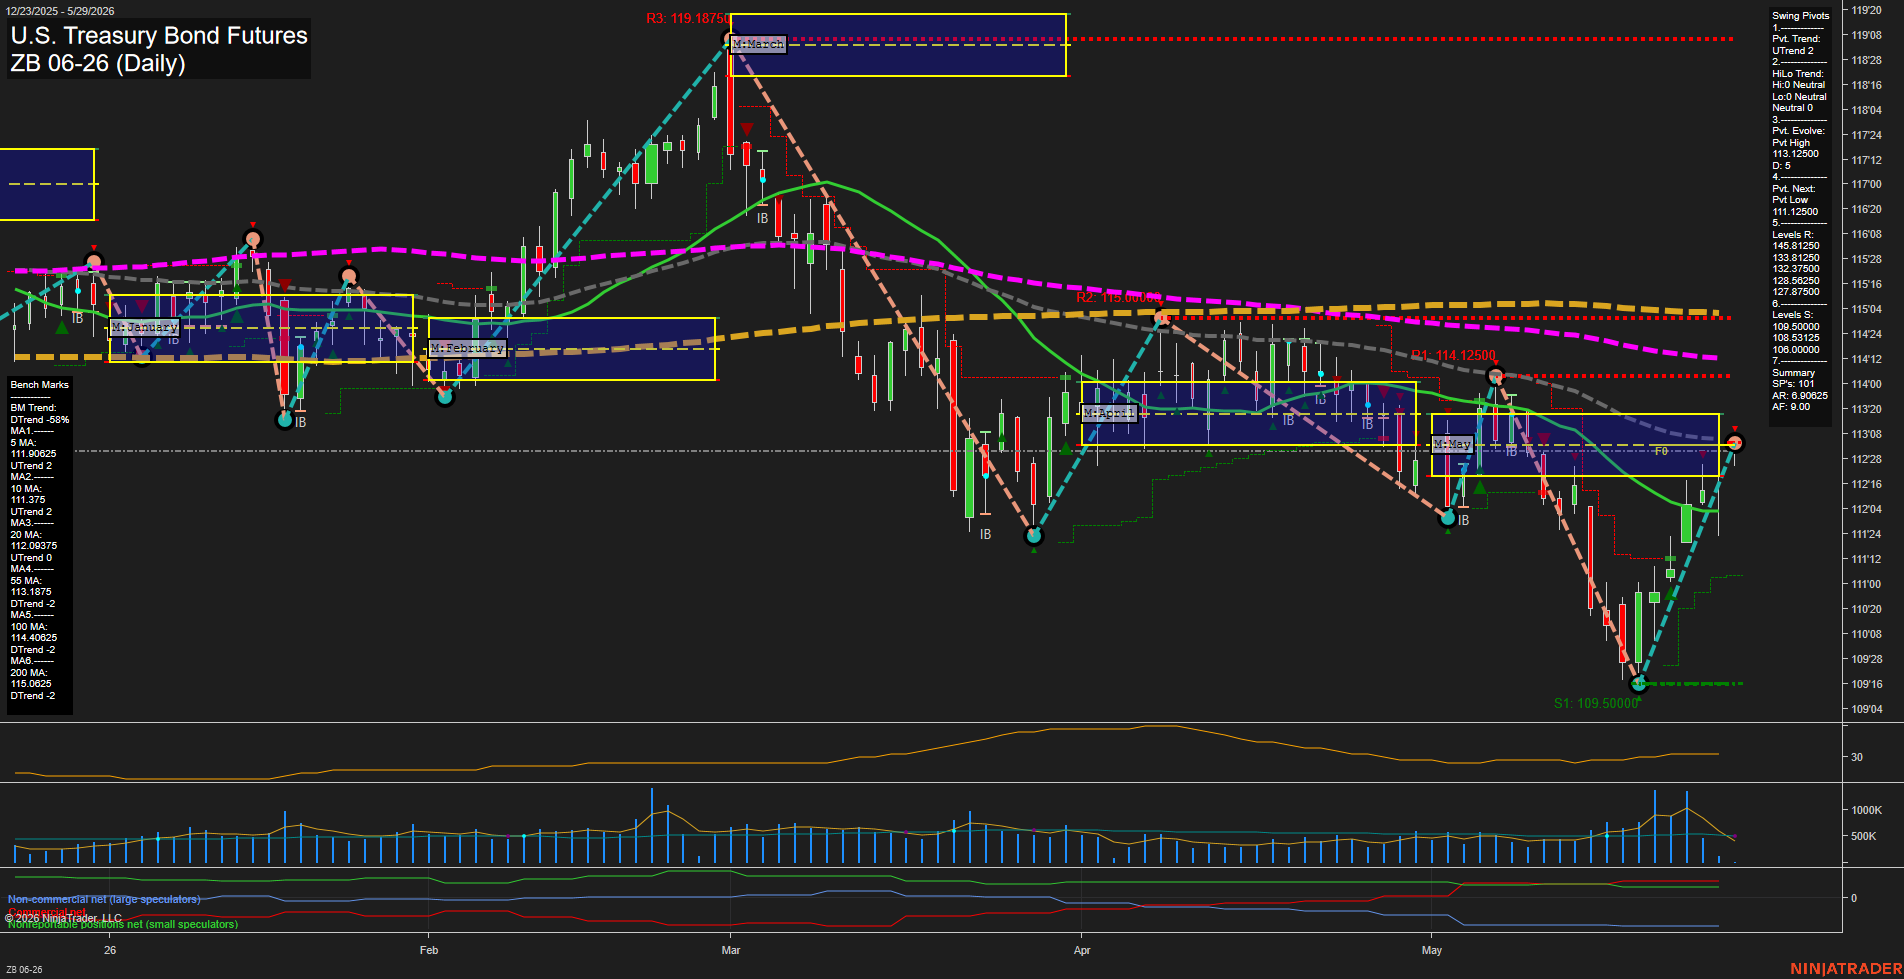
ZB U.S. Treasury Bond Futures Daily Chart Analysis: 2026-May-29 07:09 CT
Price Action
- Last: 112'28,
- Bars: Large,
- Mom: Fast.
WSFG Weekly
- Short-Term
- WSFG Current: NA%
- F0%/NTZ' Bias: Price Neutral,
- WSFG Trend: Neutral.
MSFG Month May
- Intermediate-Term
- MSFG Current: NA%
- F0%/NTZ' Bias: Price Neutral,
- MSFG Trend: Neutral.
YSFG Year 2026
- Long-Term
- YSFG Current: NA%
- F0%/NTZ' Bias: Price Neutral,
- YSFG Trend: Neutral.
Swing Pivots
- (Short-Term) 1. Pvt. Trend: UTrend,
- (Intermediate-Term) 2. HiLo Trend: DTrend,
- 3. Pvt. Evolve: Pvt High 113.12500,
- 4. Pvt. Next: Pvt Low 111.12500,
- 5. Levels R: 145.81250, 133.81250, 132.37500, 128.58250, 127.87500,
- 6. Levels S: 109.50000, 108.53125, 106.00000.
Daily Benchmarks
- (Short-Term) 5 Day: 111.90625 Up Trend,
- (Short-Term) 10 Day: 111.375 Up Trend,
- (Intermediate-Term) 20 Day: 112.09375 Up Trend,
- (Intermediate-Term) 55 Day: 113.1875 Down Trend,
- (Long-Term) 100 Day: 114.40625 Down Trend,
- (Long-Term) 200 Day: 115.0625 Down Trend.
Additional Metrics
Overall Rating
- Short-Term: Bullish,
- Intermediate-Term: Bearish,
- Long-Term: Bearish.
Key Insights Summary
Daily structure shows a sharp late-stage recovery off the 109'16 swing low, with the most recent candles rebounding back toward the 112'28 area after a steep May decline. Short-term pivot trend is back in UTrend and the 5/10 day benchmarks are aligned above price action support, matching the current bounce phase. Intermediate and long-term context remain heavier, with the 55, 100, and 200 day benchmarks still in down trends and the larger swing sequence still defined by lower highs below the March peak near 119'18. The chart is now in a recovery leg inside a broader corrective downtrend, with the current move testing prior congestion and the nearby 20 day benchmark zone while remaining below the larger declining moving average stack.
Chart Analysis ATS AI Generated: 2026-05-29 07:09 for Informational use only, not trading advice. Terms and Risk Disclosure Copyright © 2026. Algo Trading Systems LLC.