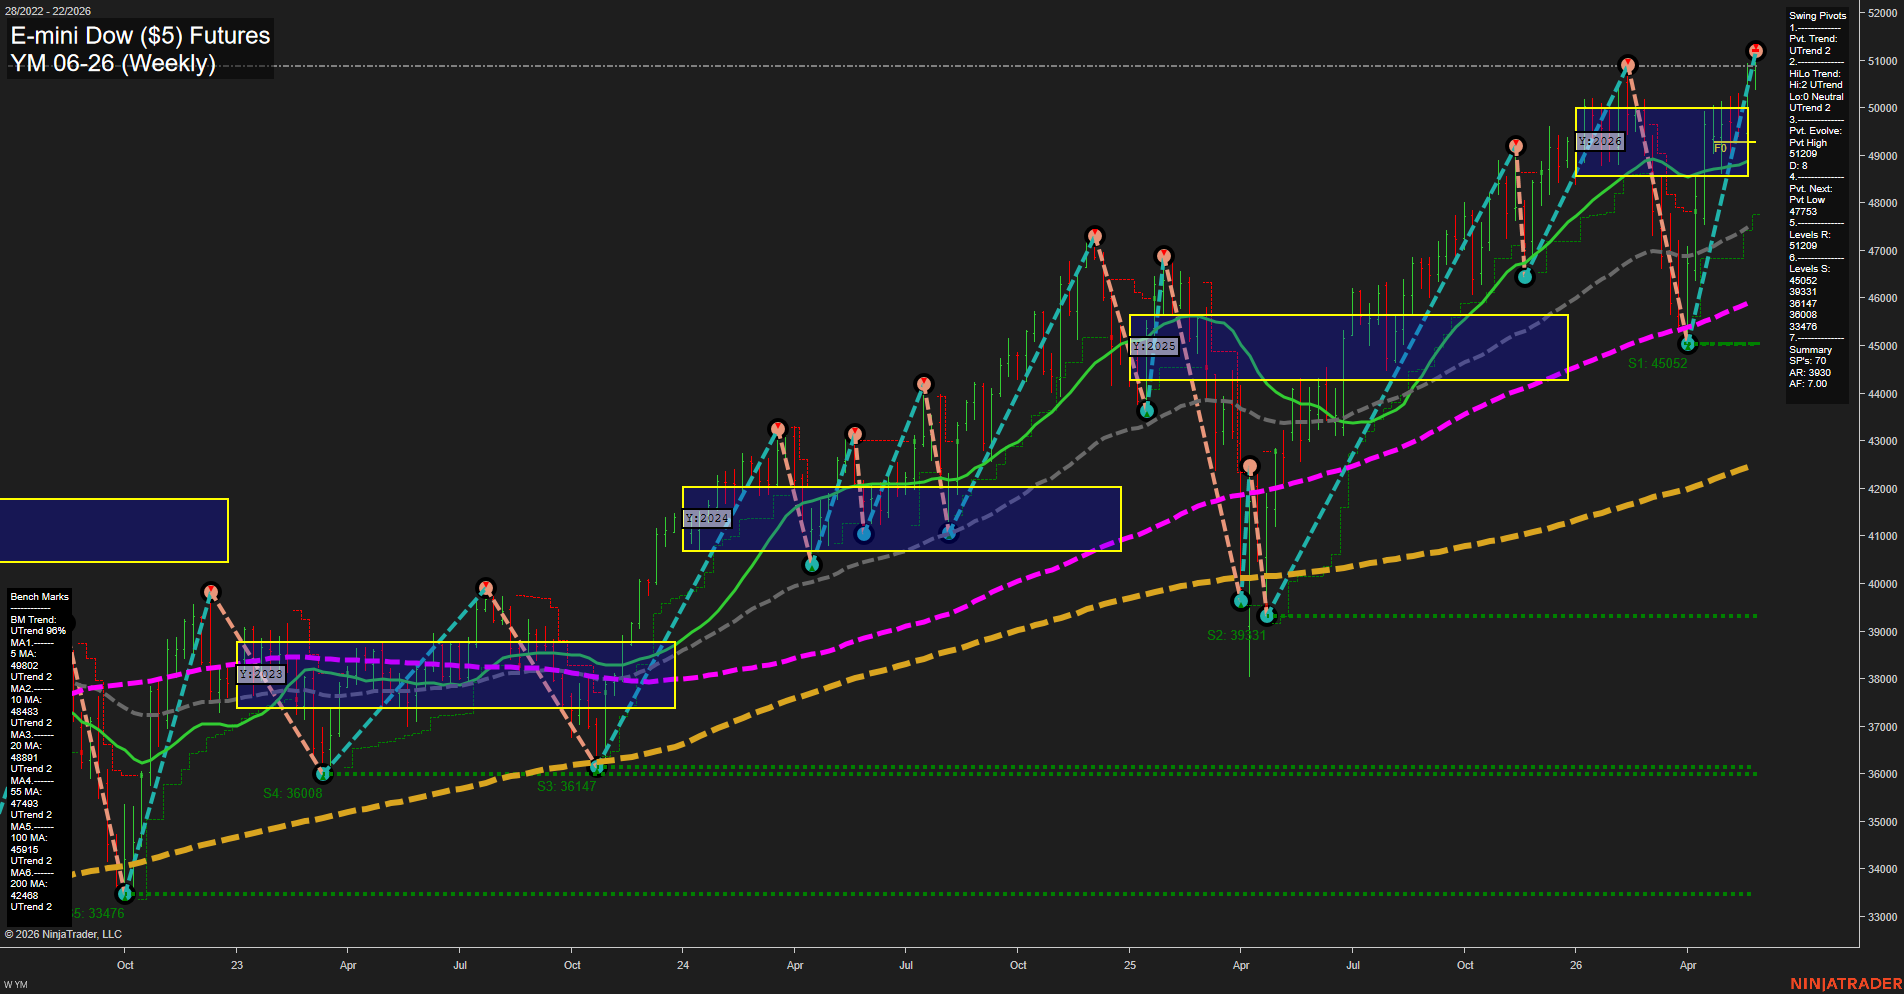
YM E-mini Dow ($5) Futures Weekly Chart Analysis: 2026-May-29 07:09 CT
Price Action
- Last: 51209,
- Bars: Large,
- Mom: fast.
WSFG Weekly
- Short-Term
- WSFG Current: 9%
- F0%/NTZ' Bias: Price Above,
- WSFG Trend: Up.
MSFG Month May
- Intermediate-Term
- MSFG Current: 36%
- F0%/NTZ' Bias: Price Above,
- MSFG Trend: Up.
YSFG Year 2026
- Long-Term
- YSFG Current: 22%
- F0%/NTZ' Bias: Price Above,
- YSFG Trend: Up.
Swing Pivots
- (Short-Term) 1. Pvt. Trend: UTrend,
- (Intermediate-Term) 2. HiLo Trend: UTrend,
- 3. Pvt. Evolve: Pvt High 51209,
- 4. Pvt. Next: Pvt Low 47753,
- 5. Levels R: 51209,
- 6. Levels S: 45052, 39331, 36147, 36008, 33476.
Weekly Benchmarks
- (Short-Term) 5 Day: 49802 Up Trend,
- (Short-Term) 10 Day: 48483 Up Trend,
- (Intermediate-Term) 20 Day: 48891 Up Trend,
- (Intermediate-Term) 55 Day: 47493 Up Trend,
- (Long-Term) 100 Day: 45915 Up Trend,
- (Long-Term) 200 Day: 42468 Up Trend.
Recent Trade Signals
- 27 May 2026: Short YM 06-26 @ 50641 Signals.USAR-WSFG
- 26 May 2026: Short YM 06-26 @ 50549 Signals.USAR.TR120
- 22 May 2026: Long YM 06-26 @ 50522 Signals.USAR-MSFG
Overall Rating
- Short-Term: Bullish,
- Intermediate-Term: Bullish,
- Long-Term: Bullish.
Key Insights Summary
The weekly structure remains firmly constructive, with price pushing to fresh highs near 51209 after a strong multi-month advance. All benchmark averages are aligned in rising order, reinforcing a broad uptrend across short-, intermediate-, and long-term horizons. The swing pivot framework is still in UTrend, with the latest move registering a new pivot high and the next reversal reference sitting lower at 47753, which reflects an established trending market with clear layered support below. Weekly, monthly, and yearly session fib grids all show price above the F0%/NTZ midpoint, confirming trend continuation behavior rather than mean-reversion dominance. Recent signals show a sequence of short-term countertrend shorts and an earlier long, but the larger technical backdrop continues to favor upward momentum, higher highs, and trend persistence.
Chart Analysis ATS AI Generated: 2026-05-29 07:09 for Informational use only, not trading advice. Terms and Risk Disclosure Copyright © 2026. Algo Trading Systems LLC.