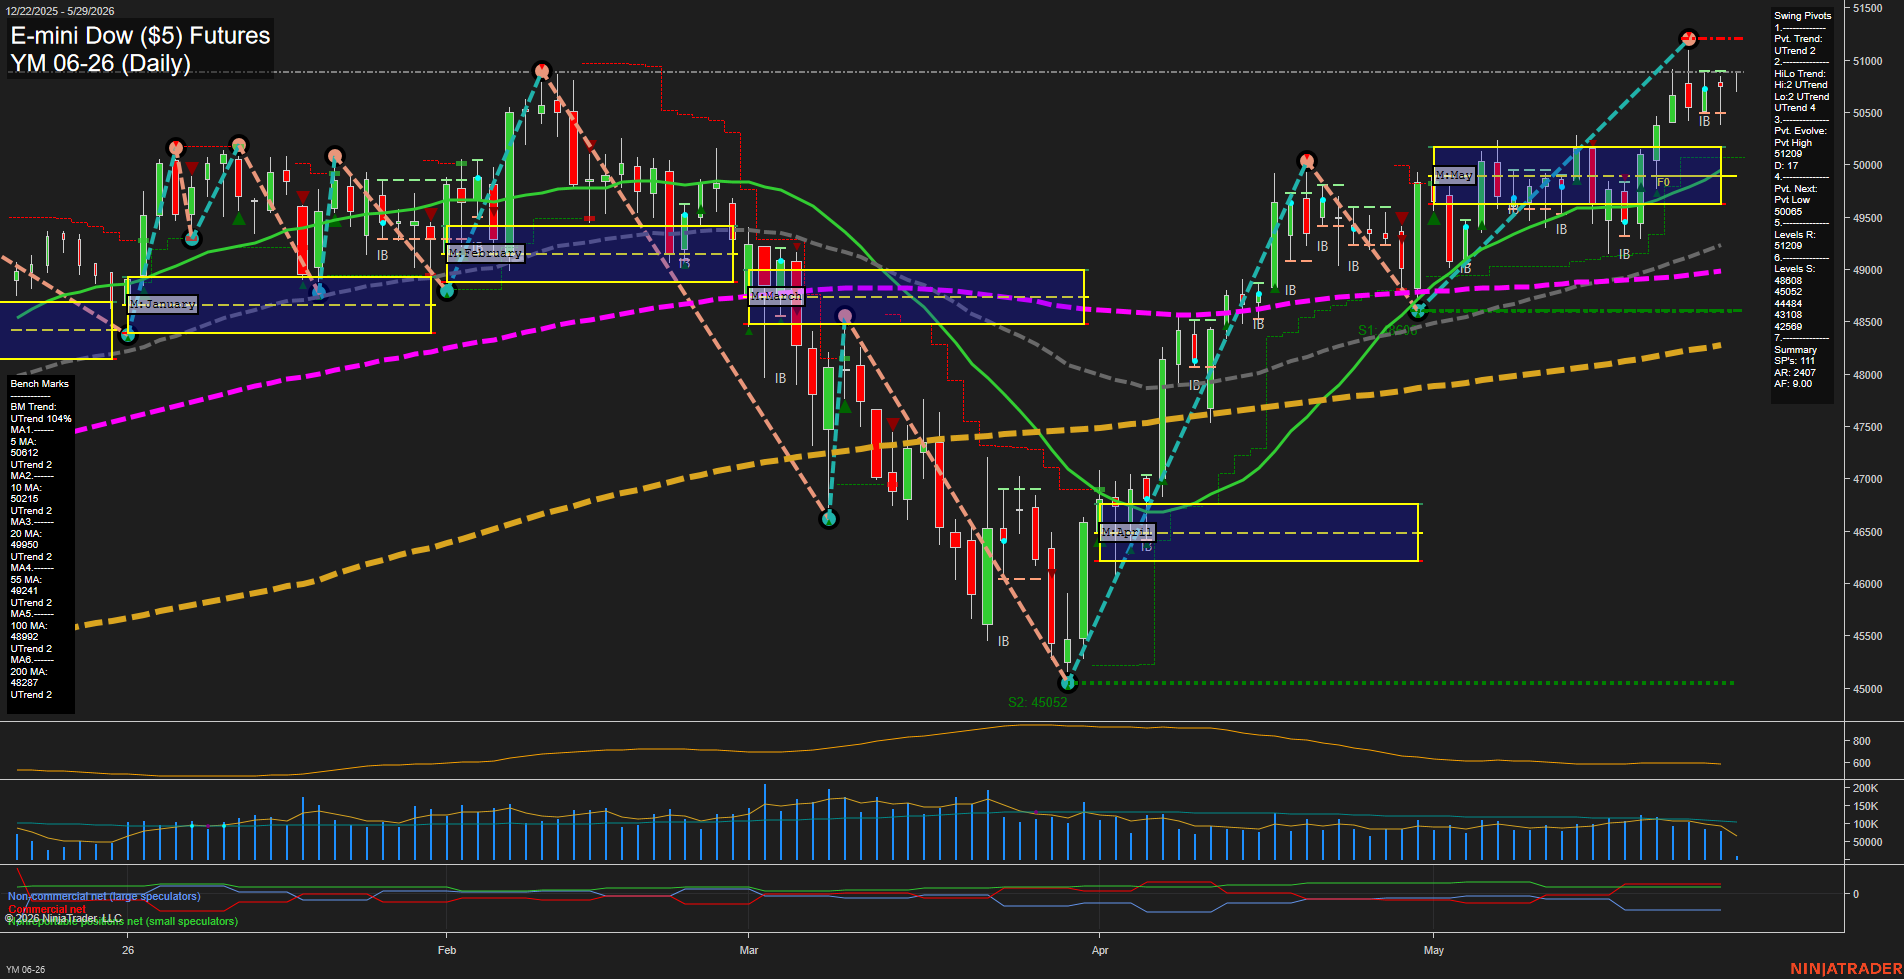
YM E-mini Dow ($5) Futures Daily Chart Analysis: 2026-May-29 07:08 CT
Price Action
- Last: 50750,
- Bars: Medium,
- Mom: average.
WSFG Weekly
- Short-Term
- WSFG Current: 9%
- F0%/NTZ' Bias: Price Above,
- WSFG Trend: Up.
MSFG Month May
- Intermediate-Term
- MSFG Current: 36%
- F0%/NTZ' Bias: Price Above,
- MSFG Trend: Up.
YSFG Year 2026
- Long-Term
- YSFG Current: 22%
- F0%/NTZ' Bias: Price Above,
- YSFG Trend: Up.
Swing Pivots
- (Short-Term) 1. Pvt. Trend: UTrend,
- (Intermediate-Term) 2. HiLo Trend: UTrend,
- 3. Pvt. Evolve: Pvt High 51209,
- 4. Pvt. Next: Pvt Low 50065,
- 5. Levels R: 51209,
- 6. Levels S: 48808, 45052, 44484, 43108, 42569.
Daily Benchmarks
- (Short-Term) 5 Day: 50612 Up Trend,
- (Short-Term) 10 Day: 50215 Up Trend,
- (Intermediate-Term) 20 Day: 49850 Up Trend,
- (Intermediate-Term) 55 Day: 49241 Up Trend,
- (Long-Term) 100 Day: 48992 Up Trend,
- (Long-Term) 200 Day: 48287 Up Trend.
Additional Metrics
Recent Trade Signals
- 27 May 2026: Short YM 06-26 @ 50641 Signals.USAR-WSFG
- 26 May 2026: Short YM 06-26 @ 50549 Signals.USAR.TR120
- 22 May 2026: Long YM 06-26 @ 50522 Signals.USAR-MSFG
Overall Rating
- Short-Term: Bullish,
- Intermediate-Term: Bullish,
- Long-Term: Bullish.
Key Insights Summary
Daily structure remains constructive with price holding above the weekly, monthly, and yearly F0%/NTZ bands while also trading above all benchmark moving averages, which keeps the swing backdrop aligned to the upside. The pivot framework shows UTrend in both the short-term pivot trend and the higher/lower pivot trend, confirming a sequence of higher highs and higher lows after the April low near 45052 and the subsequent recovery. The recent advance has pushed into the upper part of the May monthly zone near the prior swing high area around 51209, so the chart reflects an extended uptrend with an inside-bar style consolidation cluster at elevated levels rather than a breakdown structure. The recent trade signals show the market responding to both short-term pullback and monthly grid triggers, consistent with a strong trending tape that is now working through resistance and consolidation after a sharp rally from the spring low.
Chart Analysis ATS AI Generated: 2026-05-29 07:09 for Informational use only, not trading advice. Terms and Risk Disclosure Copyright © 2026. Algo Trading Systems LLC.