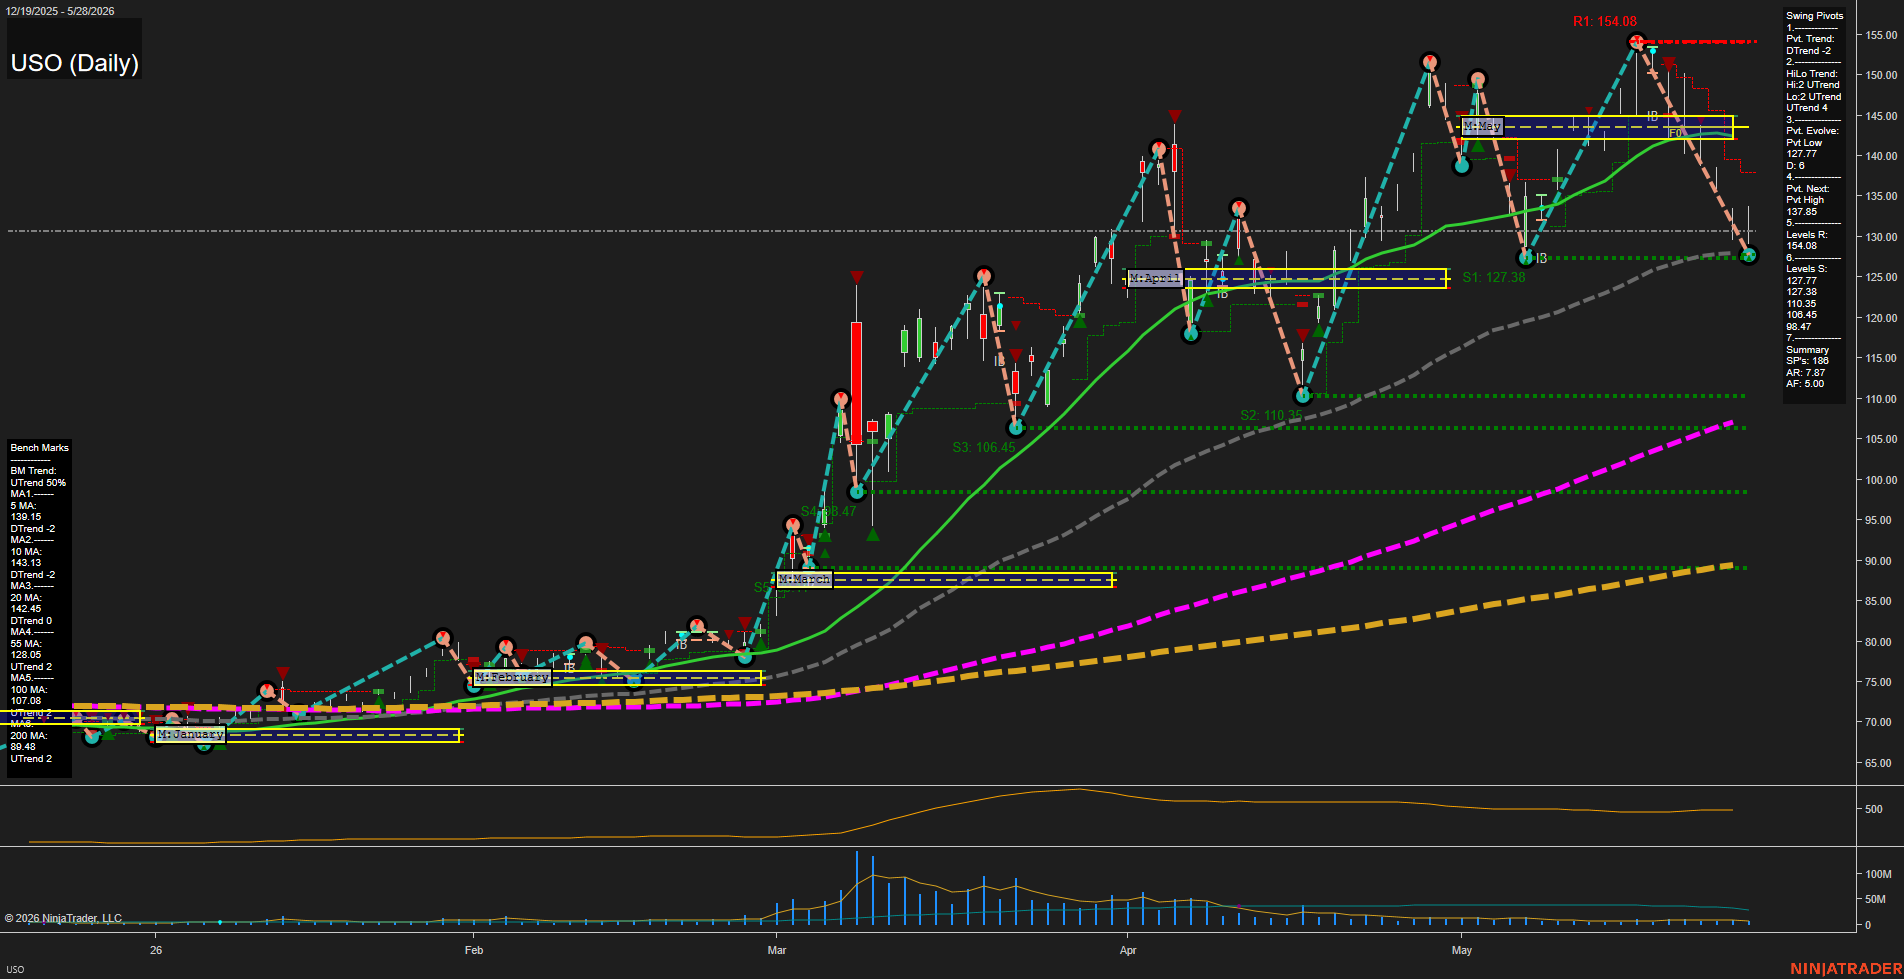
USO United States Oil Fund LP Daily Chart Analysis: 2026-May-29 07:08 CT
Price Action
- Last: 127.77,
- Bars: Large,
- Mom: fast.
WSFG Weekly
- Short-Term
- WSFG Current: NA%
- F0%/NTZ' Bias: Price Neutral,
- WSFG Trend: Neutral.
MSFG Month May
- Intermediate-Term
- MSFG Current: NA%
- F0%/NTZ' Bias: Price Neutral,
- MSFG Trend: Neutral.
YSFG Year 2026
- Long-Term
- YSFG Current: NA%
- F0%/NTZ' Bias: Price Neutral,
- YSFG Trend: Neutral.
Swing Pivots
- (Short-Term) 1. Pvt. Trend: DTrend,
- (Intermediate-Term) 2. HiLo Trend: UTrend,
- 3. Pvt. Evolve: Pvt Low 127.77,
- 4. Pvt. Next: Pvt High 137.85,
- 5. Levels R: 154.08,
- 6. Levels S: 127.77, 127.38, 110.35, 108.45, 98.47.
Daily Benchmarks
- (Short-Term) 5 Day: 139.15 Down Trend,
- (Short-Term) 10 Day: 143.13 Down Trend,
- (Intermediate-Term) 20 Day: 142.45 Down Trend,
- (Intermediate-Term) 55 Day: 128.05 Up Trend,
- (Long-Term) 100 Day: 107.08 Up Trend,
- (Long-Term) 200 Day: 89.48 Up Trend.
Additional Metrics
- ATR: 7.87,
- VOLMA: 2577640.
Overall Rating
- Short-Term: Bearish,
- Intermediate-Term: Bullish,
- Long-Term: Bullish.
Key Insights Summary
USO is in a broad uptrend on the higher timeframes, but the daily structure has rolled over into a short-term corrective phase after an extended rally. Price is sitting at the lower edge of the May monthly NTZ zone and below the 5, 10, and 20 day benchmarks, which aligns with the current DTrend swing pivot read. Even so, the intermediate and long-term moving average stack remains constructive, with price still above the 55, 100, and 200 day benchmarks and the HiLo trend still pointed up. The chart shows a rotational, stair-step advance from the March breakout through multiple higher highs and higher lows, followed by a sharp pullback from the recent peak near 154.08 into the 127 area, leaving the tape in a test-and-reaction phase rather than a clean continuation. The overall pattern is still trend-positive on the larger swing frame, but the immediate daily momentum is heavy and choppy after the recent selloff from the highs.
Chart Analysis ATS AI Generated: 2026-05-29 07:08 for Informational use only, not trading advice. Terms and Risk Disclosure Copyright © 2026. Algo Trading Systems LLC.