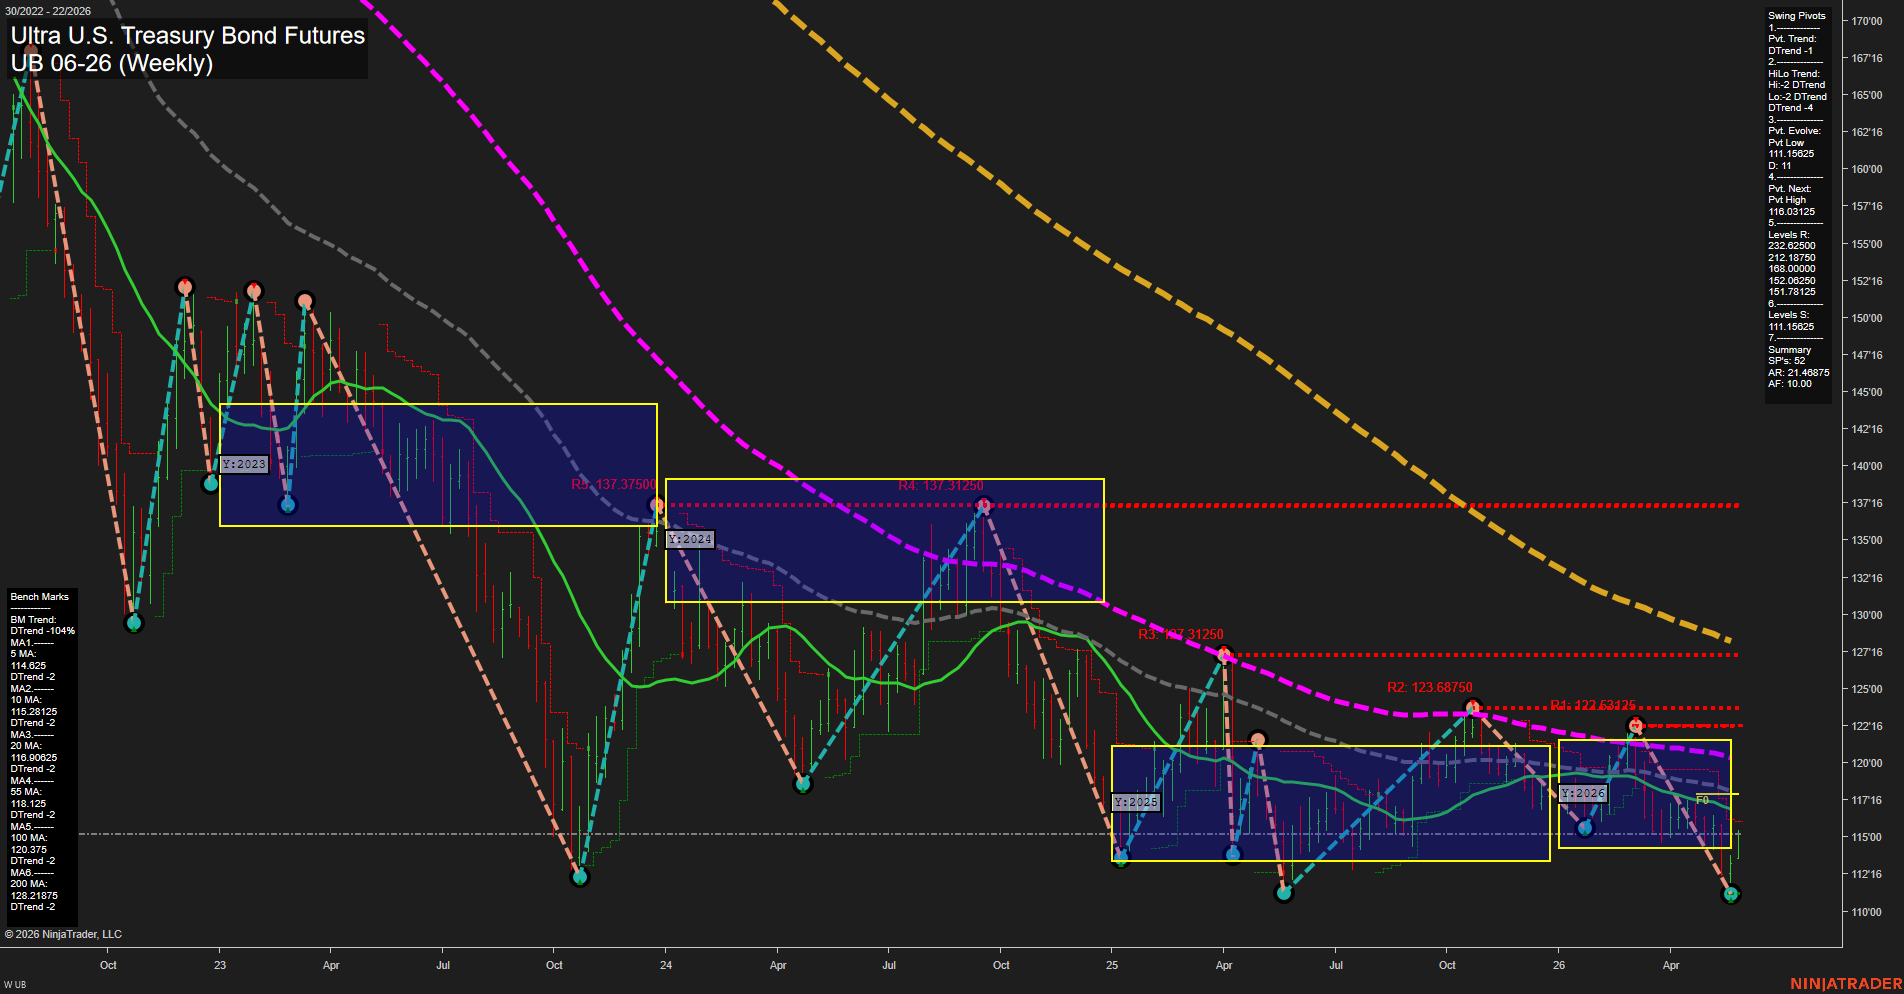
UB Ultra U.S. Treasury Bond Futures Weekly Chart Analysis: 2026-May-29 07:08 CT
Price Action
- Last: 111.15625,
- Bars: Small,
- Mom: slow.
WSFG Weekly
- Short-Term
- WSFG Current: 68%
- F0%/NTZ' Bias: Price Above,
- WSFG Trend: Up.
MSFG Month May
- Intermediate-Term
- MSFG Current: 4%
- F0%/NTZ' Bias: Price Above,
- MSFG Trend: Up.
YSFG Year 2026
- Long-Term
- YSFG Current: -7%
- F0%/NTZ' Bias: Price Below,
- YSFG Trend: Down.
Swing Pivots
- (Short-Term) 1. Pvt. Trend: DTrend,
- (Intermediate-Term) 2. HiLo Trend: DTrend,
- 3. Pvt. Evolve: Pvt Low 111.15625,
- 4. Pvt. Next: Pvt High 116.03125,
- 5. Levels R: 232.62500, 212.18750, 168.00000, 152.06250, 151.78125.
- 6. Levels S: 111.15625.
Weekly Benchmarks
- (Short-Term) 5 Day: 114.625 Down Trend,
- (Short-Term) 10 Day: 115.28125 Down Trend,
- (Intermediate-Term) 20 Day: 116.90625 Down Trend,
- (Intermediate-Term) 55 Day: 118.125 Down Trend,
- (Long-Term) 100 Day: 120.375 Down Trend,
- (Long-Term) 200 Day: 128.21875 Down Trend.
Recent Trade Signals
- 25 May 2026: Long UB 06-26 @ 114.25 Signals.USAR.TR720
- 25 May 2026: Long UB 06-26 @ 114.03125 Signals.USAR-WSFG
Overall Rating
- Short-Term: Bearish,
- Intermediate-Term: Bearish,
- Long-Term: Bearish.
Key Insights Summary
The weekly structure remains heavy, with price pressing near the 2026 pivot low around 111.15625 while all benchmark moving averages are stacked in a persistent downtrend above price. The short-term pivot trend is still DTrend and the intermediate HiLo trend also remains DTrend, which keeps the broader weekly swing structure aligned to the downside despite the WSFG reading turning upward inside the current session box. That creates a mixed short-term backdrop: recent signals show long entries, but they are occurring within a larger bearish trend regime and beneath declining benchmarks. The yearly fib grid remains below its f0%/NTZ centerline, reinforcing the long-term downside bias, while the monthly and weekly session grids sit in recovery mode but have not yet fully reversed the dominant trend. Overall, the chart reflects a bear-trend market with intermittent countertrend rallies, lower highs, and repeated tests back toward the lower pivot zone.
Chart Analysis ATS AI Generated: 2026-05-29 07:08 for Informational use only, not trading advice. Terms and Risk Disclosure Copyright © 2026. Algo Trading Systems LLC.