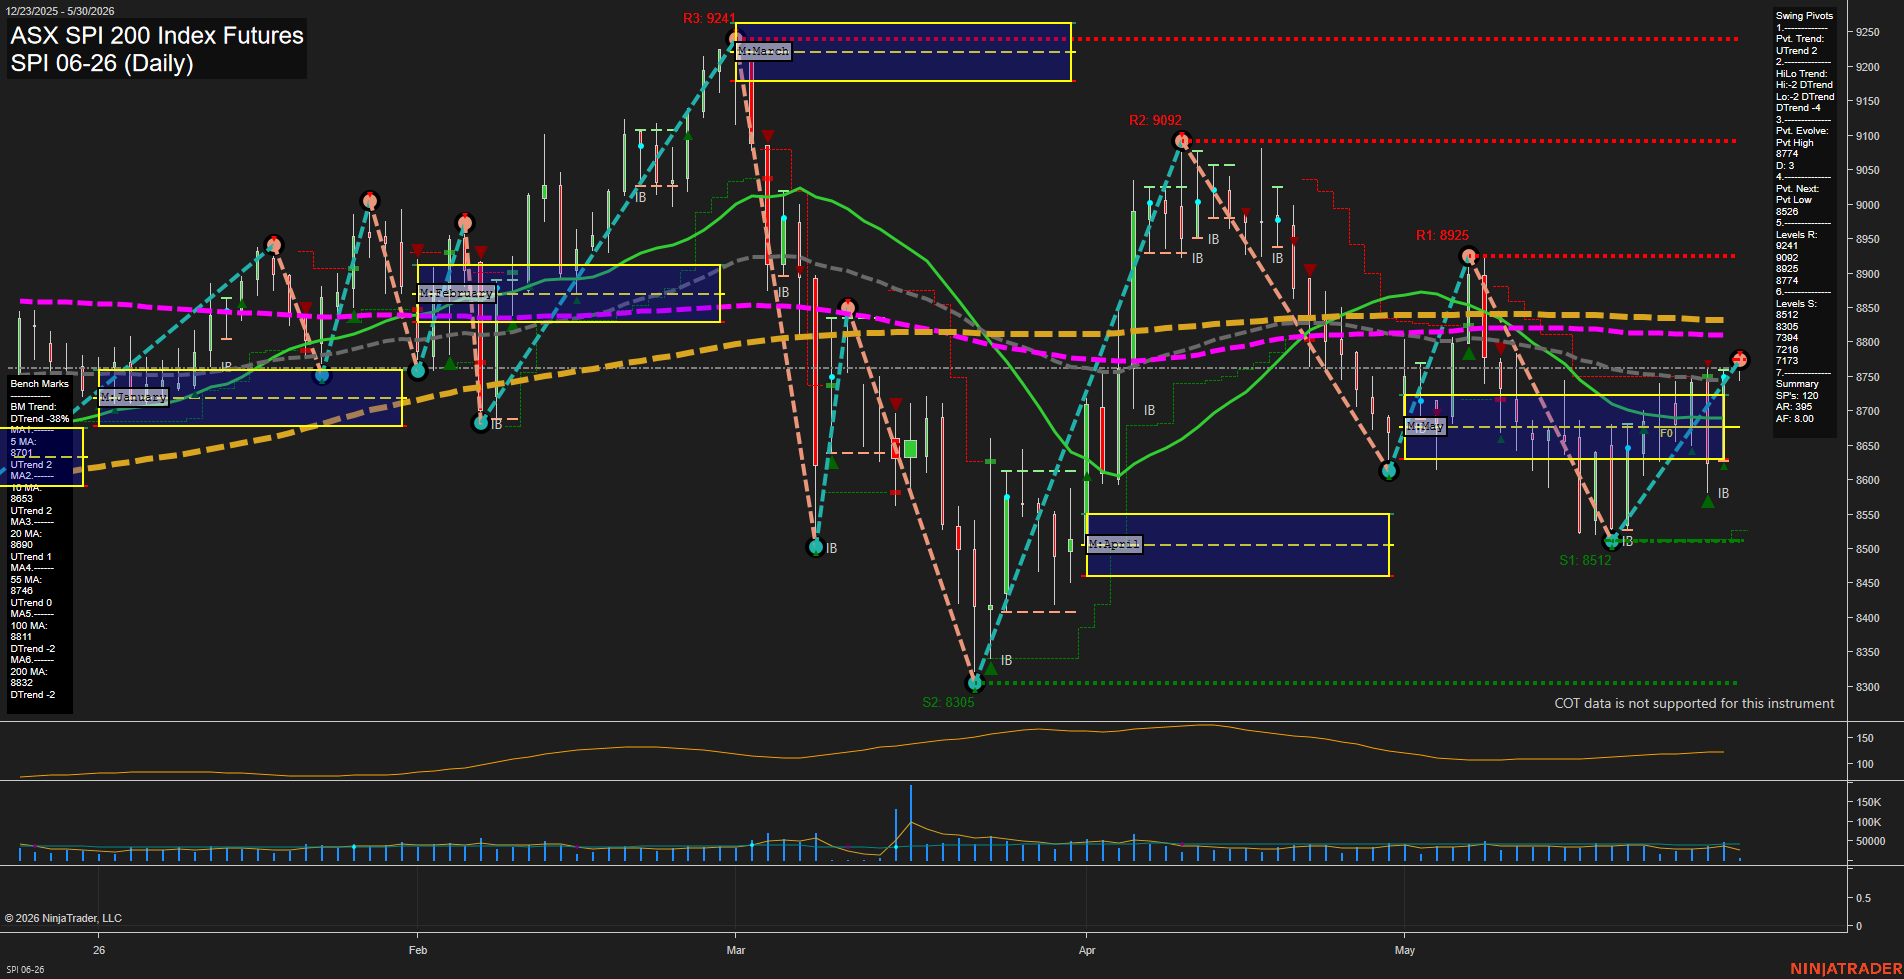
SPI ASX SPI 200 Index Futures Daily Chart Analysis: 2026-May-29 07:07 CT
Price Action
- Last: 8770,
- Bars: Medium,
- Mom: average.
WSFG Weekly
- Short-Term
- WSFG Current: NA%
- F0%/NTZ' Bias: Price Neutral,
- WSFG Trend: Neutral.
MSFG Month May
- Intermediate-Term
- MSFG Current: NA%
- F0%/NTZ' Bias: Price Neutral,
- MSFG Trend: Neutral.
YSFG Year 2026
- Long-Term
- YSFG Current: NA%
- F0%/NTZ' Bias: Price Neutral,
- YSFG Trend: Neutral.
Swing Pivots
- (Short-Term) 1. Pvt. Trend: UTrend,
- (Intermediate-Term) 2. HiLo Trend: DTrend,
- 3. Pvt. Evolve: Pvt High 8774,
- 4. Pvt. Next: Pvt Low 8526,
- 5. Levels R: 9241, 9092, 8925, 8774,
- 6. Levels S: 8512, 8305, 7394, 7216, 7173.
Daily Benchmarks
- (Short-Term) 5 Day: 8701 Up Trend,
- (Short-Term) 10 Day: 8653 Up Trend,
- (Intermediate-Term) 20 Day: 8090 Up Trend,
- (Intermediate-Term) 55 Day: 8746 Down Trend,
- (Long-Term) 100 Day: 8811 Down Trend,
- (Long-Term) 200 Day: 8832 Down Trend.
Additional Metrics
Overall Rating
- Short-Term: Bullish,
- Intermediate-Term: Neutral,
- Long-Term: Bearish.
Key Insights Summary
Price is holding a recovery structure after the May swing low and is pressing back into the upper part of the May MSFG, with the current pivot trend still positive while the higher-timeframe swing structure remains mixed. The daily tape shows a medium-range bar environment with average momentum, indicating a transition phase rather than a clean trend acceleration. Short-term benchmarks are aligned above price support zones, while the 55, 100, and 200 day measures remain below the market context and keep the longer-term backdrop constructive only on rallies, not fully confirmed on the broader trend. Swing pivot resistance sits overhead at 8925, then 9092 and 9241, while support is layered at 8512 and 8305, framing the current range between recovery continuation and prior drawdown reference levels.
Chart Analysis ATS AI Generated: 2026-05-29 07:07 for Informational use only, not trading advice. Terms and Risk Disclosure Copyright © 2026. Algo Trading Systems LLC.