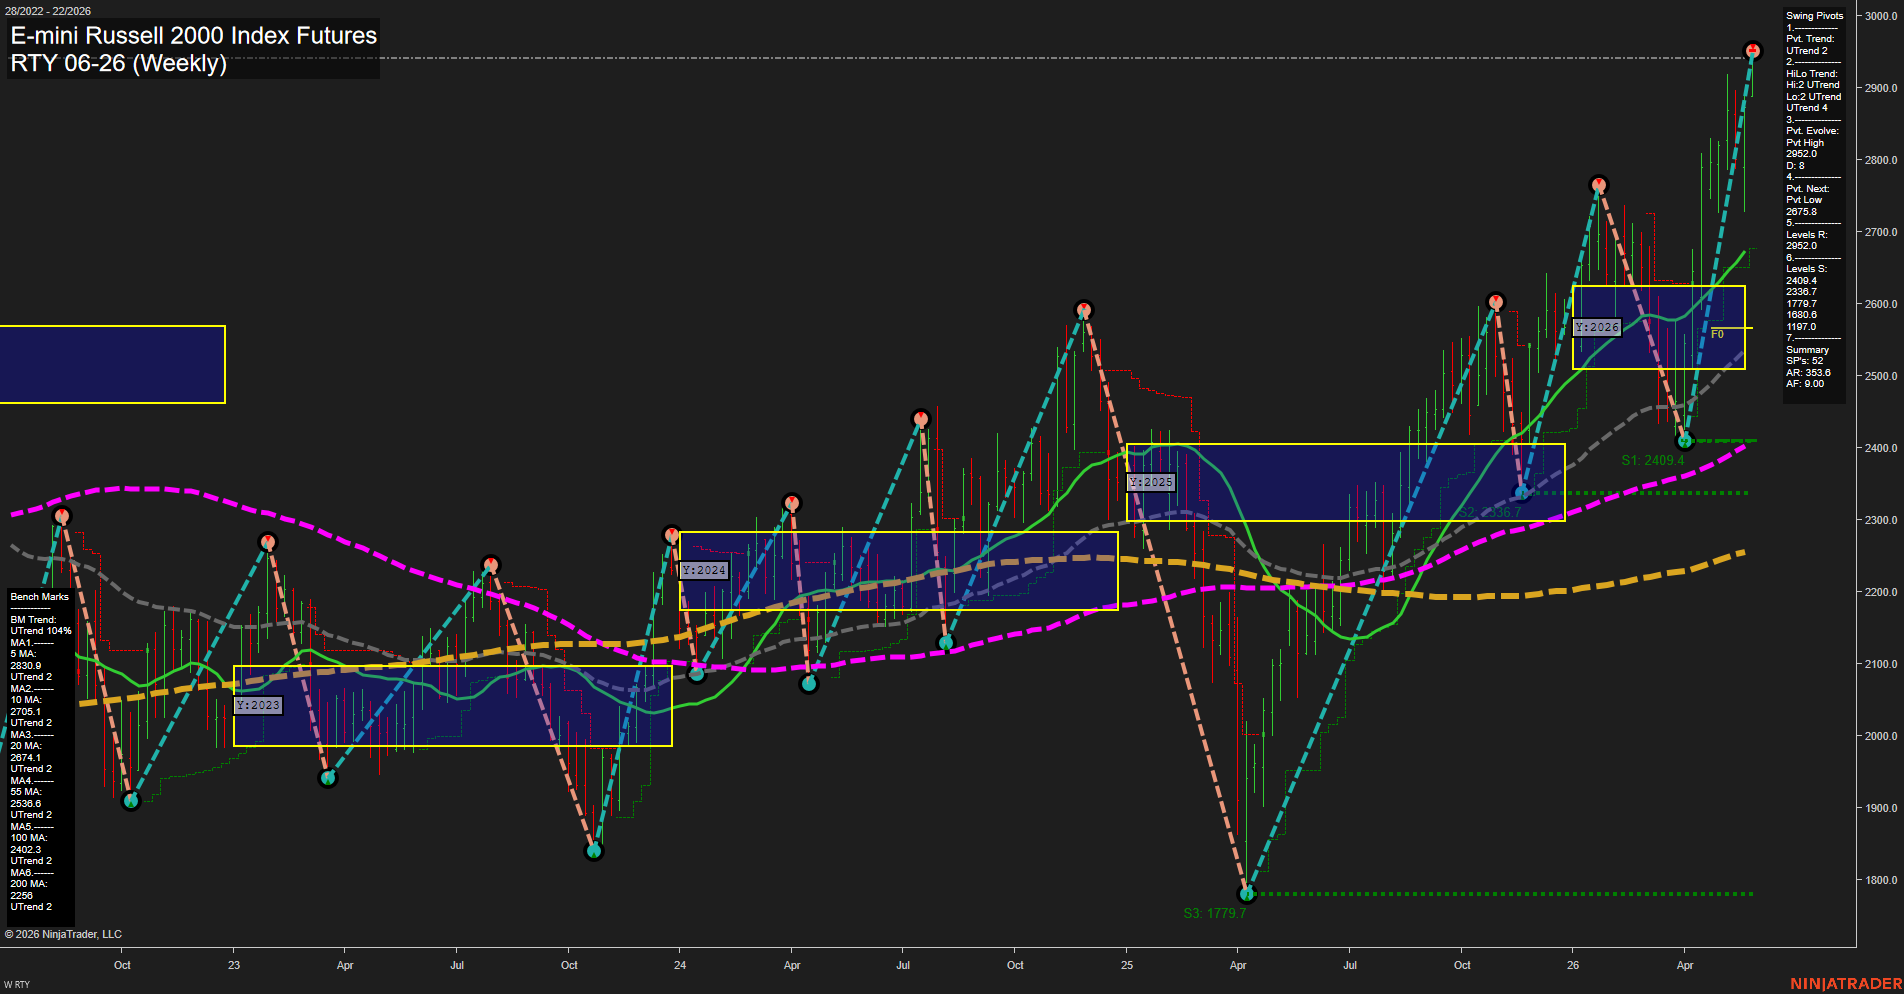
RTY E-mini Russell 2000 Index Futures Weekly Chart Analysis: 2026-May-29 07:07 CT
Price Action
- Last: 2952.0,
- Bars: Large,
- Mom: Fast.
WSFG Weekly
- Short-Term
- WSFG Current: 44%
- F0%/NTZ' Bias: Price Above,
- WSFG Trend: Up.
MSFG Month May
- Intermediate-Term
- MSFG Current: 62%
- F0%/NTZ' Bias: Price Above,
- MSFG Trend: Up.
YSFG Year 2026
- Long-Term
- YSFG Current: 65%
- F0%/NTZ' Bias: Price Above,
- YSFG Trend: Up.
Swing Pivots
- (Short-Term) 1. Pvt. Trend: UTrend,
- (Intermediate-Term) 2. HiLo Trend: UTrend,
- 3. Pvt. Evolve: Pvt High 2952.0,
- 4. Pvt. Next: Pvt Low 2875.8,
- 5. Levels R: 2952.0,
- 6. Levels S: 2409.4, 2336.7, 1779.7.
Weekly Benchmarks
- (Short-Term) 5 Day: 2830.9 Up Trend,
- (Short-Term) 10 Day: 2705.1 Up Trend,
- (Intermediate-Term) 20 Day: 2674.1 Up Trend,
- (Intermediate-Term) 55 Day: 2536.8 Up Trend,
- (Long-Term) 100 Day: 2402.3 Up Trend,
- (Long-Term) 200 Day: 2256.0 Up Trend.
Recent Trade Signals
- 28 May 2026: Short RTY 06-26 @ 2906.3 Signals.USAR.TR120
- 26 May 2026: Long RTY 06-26 @ 2914.9 Signals.USAR-WSFG
- 25 May 2026: Long RTY 06-26 @ 2912 Signals.USAR.TR720
- 21 May 2026: Long RTY 06-26 @ 2850.1 Signals.USAR-MSFG
Overall Rating
- Short-Term: Bullish,
- Intermediate-Term: Bullish,
- Long-Term: Bullish.
Key Insights Summary
RTY is in a strong weekly advance with price pressing into new highs near 2952 after a sharp recovery from the 2025 spring low area. The structure shows a sequence of higher highs and higher lows, with the swing pivot trend and HiLo trend both aligned to the upside. Price remains above the weekly, monthly, and yearly F0%/NTZ reference zones, and all benchmark moving averages from 5 Day through 200 Day are stacked in bullish up-trend alignment. The recent signal mix still shows some short-term two-way activity, but the dominant pattern is continuation strength, with momentum expanding and the larger cycle holding in breakout mode rather than consolidation.
Chart Analysis ATS AI Generated: 2026-05-29 07:07 for Informational use only, not trading advice. Terms and Risk Disclosure Copyright © 2026. Algo Trading Systems LLC.