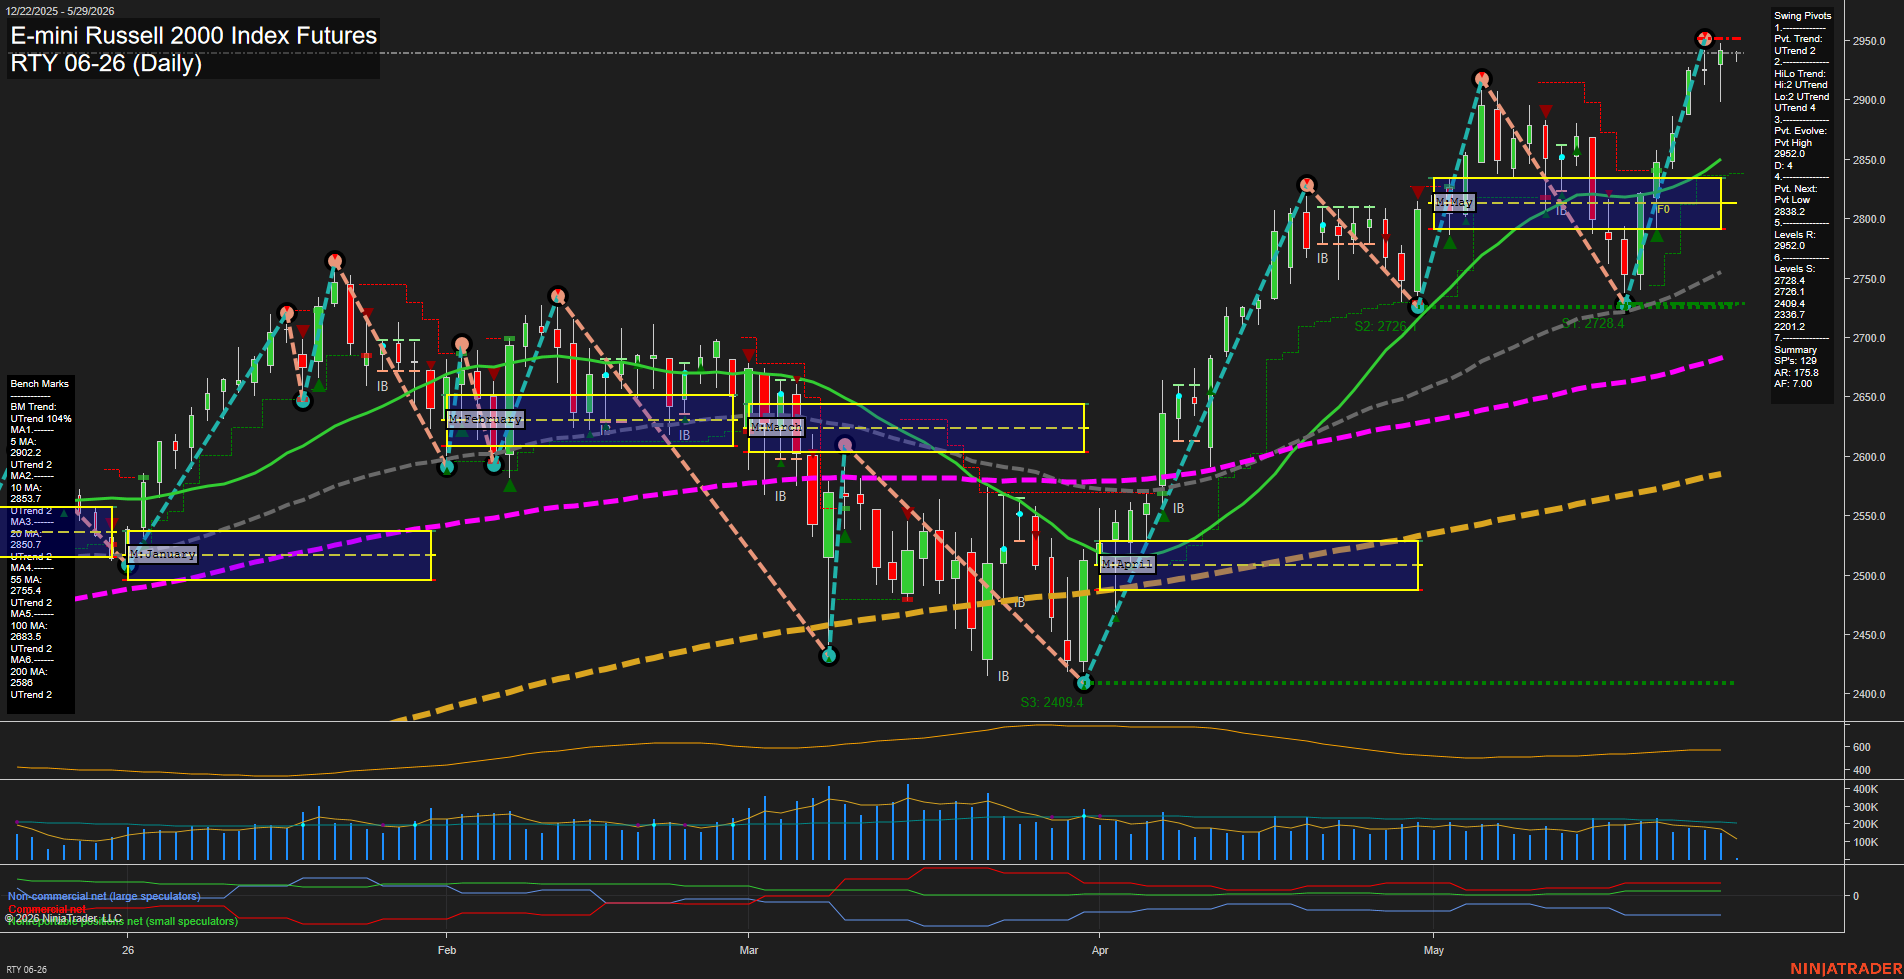
RTY E-mini Russell 2000 Index Futures Daily Chart Analysis: 2026-May-29 07:07 CT
Price Action
- Last: 2949.0,
- Bars: Large,
- Mom: fast.
WSFG Weekly
- Short-Term
- WSFG Current: 44%
- F0%/NTZ' Bias: Price Above,
- WSFG Trend: Up.
MSFG Month May
- Intermediate-Term
- MSFG Current: 62%
- F0%/NTZ' Bias: Price Above,
- MSFG Trend: Up.
YSFG Year 2026
- Long-Term
- YSFG Current: 65%
- F0%/NTZ' Bias: Price Above,
- YSFG Trend: Up.
Swing Pivots
- (Short-Term) 1. Pvt. Trend: UTrend,
- (Intermediate-Term) 2. HiLo Trend: UTrend,
- 3. Pvt. Evolve: Pvt High 2952.0,
- 4. Pvt. Next: Pvt Low 2838.2,
- 5. Levels R: 2952.0,
- 6. Levels S: 2728.4, 2726.1, 2409.4, 2338.7, 2201.2.
Daily Benchmarks
- (Short-Term) 5 Day: 2902.2 Up Trend,
- (Short-Term) 10 Day: 2853.7 Up Trend,
- (Intermediate-Term) 20 Day: 2800.7 Up Trend,
- (Intermediate-Term) 55 Day: 2755.4 Up Trend,
- (Long-Term) 100 Day: 2683.5 Up Trend,
- (Long-Term) 200 Day: 2586.0 Up Trend.
Additional Metrics
- ATR: 175.8,
- VOLMA: 169463.
Recent Trade Signals
- 28 May 2026: Short RTY 06-26 @ 2906.3 Signals.USAR.TR120
- 26 May 2026: Long RTY 06-26 @ 2914.9 Signals.USAR-WSFG
- 25 May 2026: Long RTY 06-26 @ 2912 Signals.USAR.TR720
- 21 May 2026: Long RTY 06-26 @ 2850.1 Signals.USAR-MSFG
Overall Rating
- Short-Term: Bullish,
- Intermediate-Term: Bullish,
- Long-Term: Bullish.
Key Insights Summary
RTY is in a strong bullish swing structure with price pressing to new highs and holding above the monthly fib grid, the weekly fib grid, and every benchmark moving average from 5-day through 200-day. The pivot structure remains UTrend across both the short-term and intermediate-term measures, with resistance only at the most recent swing high near 2952.0 and support anchored well below at 2728.4 and 2726.1. The daily action shows a powerful rally sequence after the April base, followed by a continuation surge into late May, which confirms strong trend persistence rather than broad consolidation. The moving average stack is fully aligned upward, reinforcing the prevailing trend, while the recent trade signals show repeated long bias through the weekly, monthly, and long-duration systems, with only a short-term counter-signal after the sharp extension.
Chart Analysis ATS AI Generated: 2026-05-29 07:07 for Informational use only, not trading advice. Terms and Risk Disclosure Copyright © 2026. Algo Trading Systems LLC.