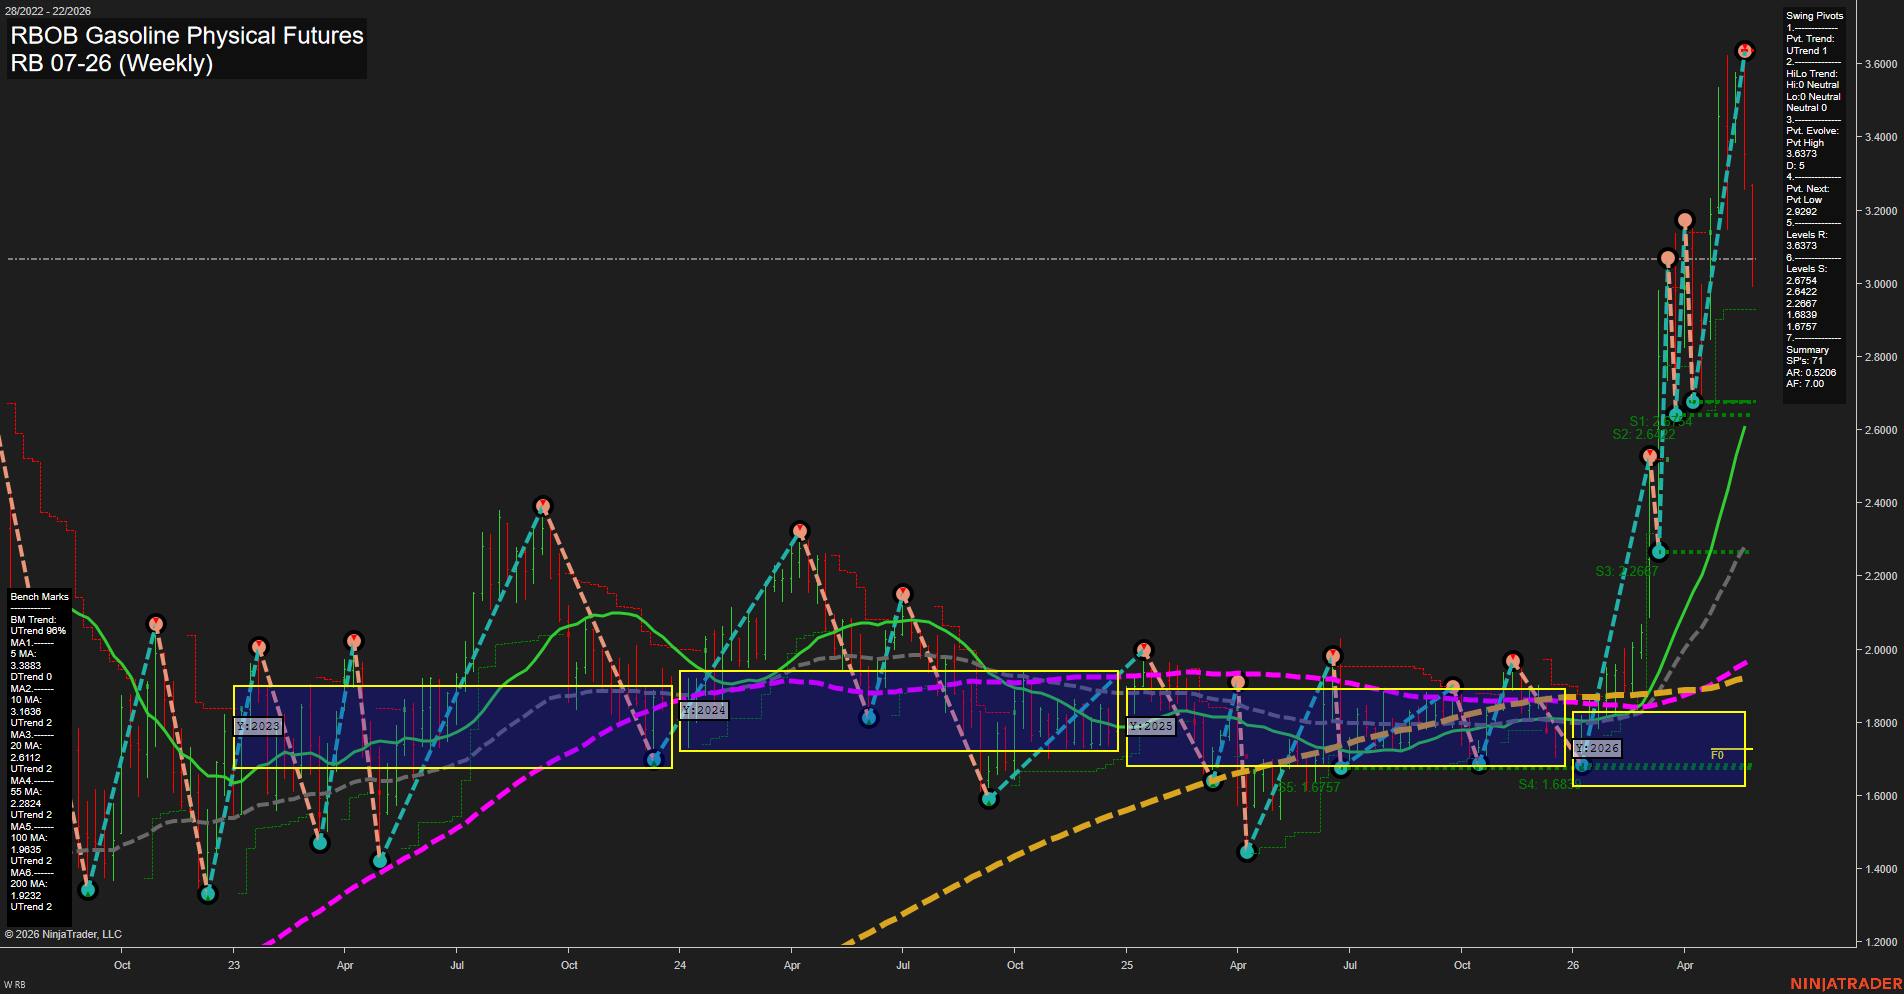
RB RBOB Gasoline Physical Futures Weekly Chart Analysis: 2026-May-29 07:06 CT
Price Action
- Last: 3.6373,
- Bars: Large,
- Mom: Fast.
WSFG Weekly
- Short-Term
- WSFG Current: -64%
- F0%/NTZ' Bias: Price Below,
- WSFG Trend: Down.
MSFG Month May
- Intermediate-Term
- MSFG Current: -78%
- F0%/NTZ' Bias: Price Below,
- MSFG Trend: Down.
YSFG Year 2026
- Long-Term
- YSFG Current: 133%
- F0%/NTZ' Bias: Price Above,
- YSFG Trend: Up.
Swing Pivots
- (Short-Term) 1. Pvt. Trend: UTrend,
- (Intermediate-Term) 2. HiLo Trend: Neutral,
- 3. Pvt. Evolve: Pvt High 3.6373,
- 4. Pvt. Next: Pvt Low 2.9292,
- 5. Levels R: 3.6373,
- 6. Levels S: 2.6754, 2.6422, 2.2867, 1.6839, 1.6757.
Weekly Benchmarks
- (Short-Term) 5 Day: 3.3883 Up Trend,
- (Short-Term) 10 Day: 3.1636 Up Trend,
- (Intermediate-Term) 20 Day: 2.6112 Up Trend,
- (Intermediate-Term) 55 Day: 2.2824 Up Trend,
- (Long-Term) 100 Day: 1.9635 Up Trend,
- (Long-Term) 200 Day: 1.9232 Up Trend.
Recent Trade Signals
- 26 May 2026: Short RB 07-26 @ 3.2057 Signals.USAR-WSFG
- 21 May 2026: Short RB 07-26 @ 3.388 Signals.USAR-MSFG
Overall Rating
- Short-Term: Neutral,
- Intermediate-Term: Bearish,
- Long-Term: Bullish.
Key Insights Summary
Weekly price action is in a powerful upside expansion phase, with a large fast-momentum breakout to new highs above 3.60 and well above all benchmark moving averages. The yearly session structure remains strongly constructive, but the weekly and monthly session fib grids are still below F0%, reflecting that the move has pushed through a longer basing area rather than yet fully normalizing those shorter-cycle measures. Swing pivot structure is now UTrend with a fresh pivot high at 3.6373 and the next downside pivot level sitting much lower at 2.9292, highlighting a sharp upward displacement and a wide gap to the nearest support stack. The moving average set is fully aligned in rising order, which confirms broad trend strength across timeframes. Recent short signals in late May came while price was still accelerating higher, underscoring how forceful the reversal and breakout sequence has been. Overall, the chart reads as a long-term bullish trend with a near-term stretched advance and an intermediate backdrop that is still working through the prior down-cycle structure.
Chart Analysis ATS AI Generated: 2026-05-29 07:07 for Informational use only, not trading advice. Terms and Risk Disclosure Copyright © 2026. Algo Trading Systems LLC.