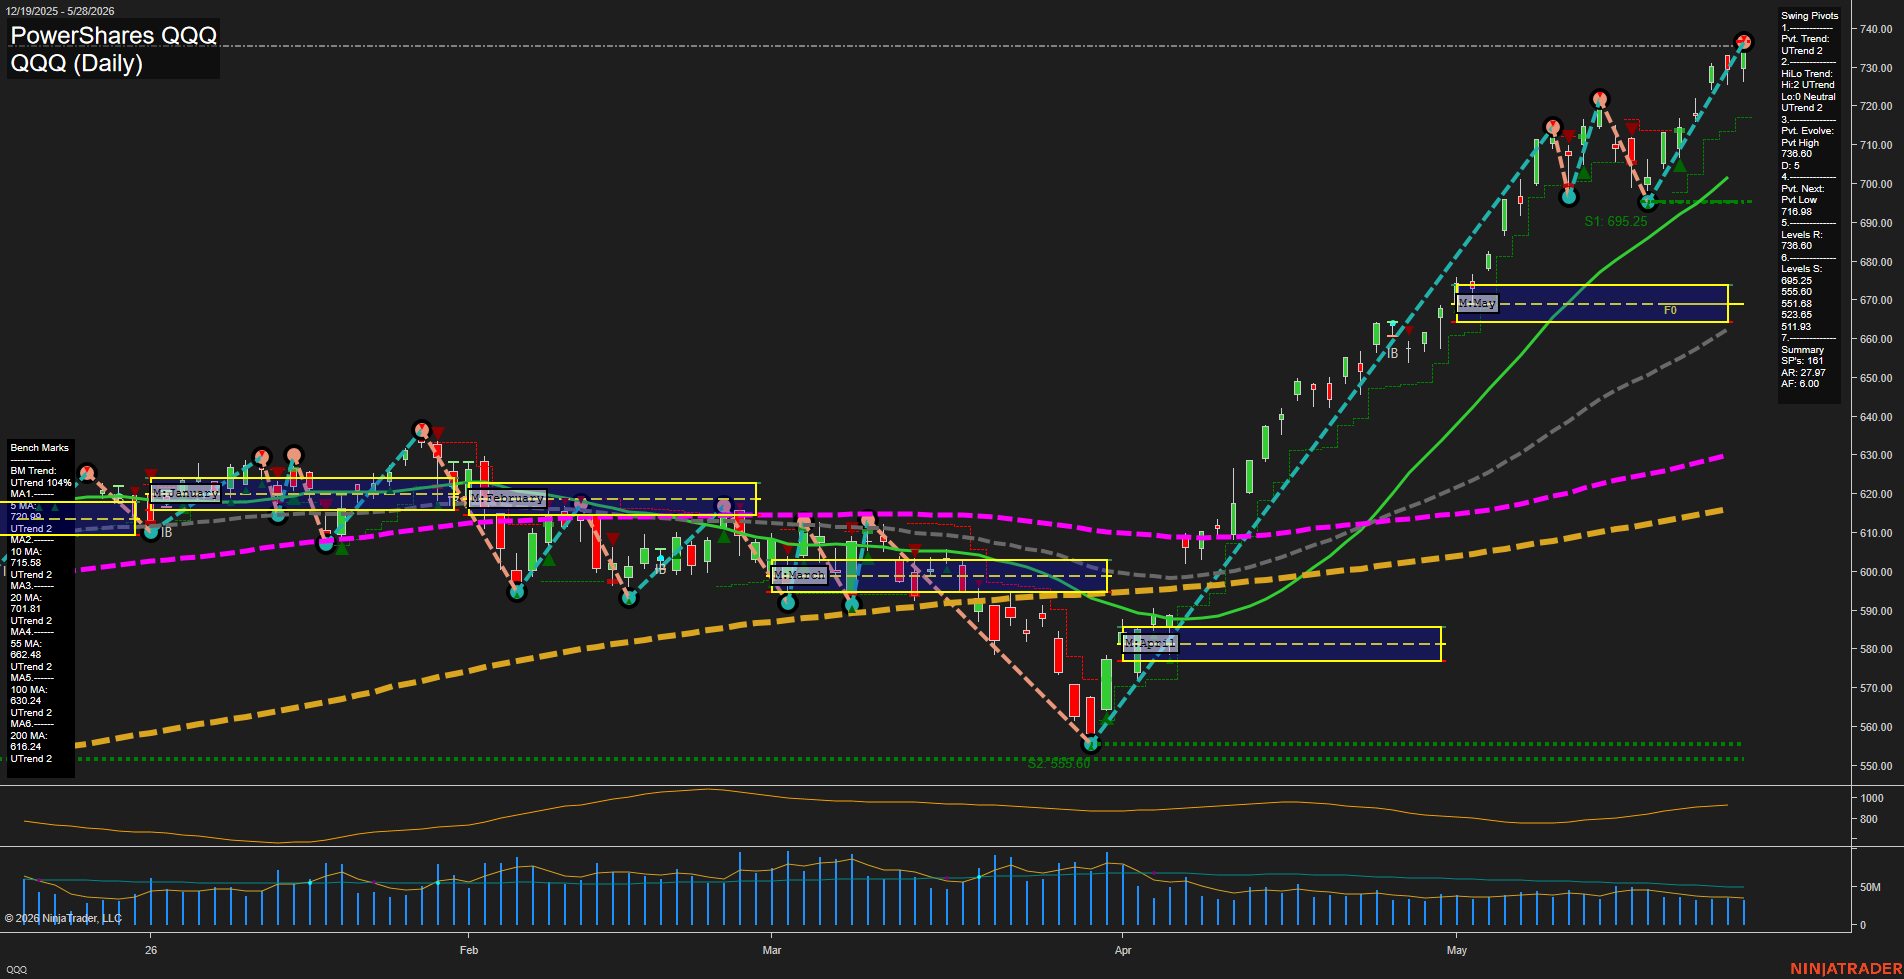
QQQ PowerShares QQQ Daily Chart Analysis: 2026-May-29 07:06 CT
Price Action
- Last: 736.80,
- Bars: Large,
- Mom: fast.
WSFG Weekly
- Short-Term
- WSFG Current: NA%
- F0%/NTZ' Bias: Price Neutral,
- WSFG Trend: Neutral.
MSFG Month May
- Intermediate-Term
- MSFG Current: NA%
- F0%/NTZ' Bias: Price Neutral,
- MSFG Trend: Neutral.
YSFG Year 2026
- Long-Term
- YSFG Current: NA%
- F0%/NTZ' Bias: Price Neutral,
- YSFG Trend: Neutral.
Swing Pivots
- (Short-Term) 1. Pvt. Trend: UTrend,
- (Intermediate-Term) 2. HiLo Trend: UTrend,
- 3. Pvt. Evolve: Pvt High 736.60,
- 4. Pvt. Next: Pvt Low 716.98,
- 5. Levels R: 736.80,
- 6. Levels S: 695.25, 555.60, 551.68, 523.65, 511.93.
Daily Benchmarks
- (Short-Term) 5 Day: 720.90 Up Trend,
- (Short-Term) 10 Day: 715.58 Up Trend,
- (Intermediate-Term) 20 Day: 701.81 Up Trend,
- (Intermediate-Term) 55 Day: 682.48 Up Trend,
- (Long-Term) 100 Day: 630.24 Up Trend,
- (Long-Term) 200 Day: 618.24 Up Trend.
Additional Metrics
- ATR: 27.97,
- VOLMA: 32709273.
Overall Rating
- Short-Term: Bullish,
- Intermediate-Term: Bullish,
- Long-Term: Bullish.
Key Insights Summary
QQQ is in a strong swing-trend expansion with price pressing new highs near 736.80 and holding well above all benchmark moving averages. The short-term pivot structure remains UTrend, and the intermediate HiLo structure is also UTrend, confirming continuation rather than mean reversion. May’s monthly fib box has been traveled decisively higher, with price sitting above the NTZ and beyond the upper monthly session area, while the yearly structure remains aligned to the upside. From a futures swing trader point of view, this is a momentum-led trend environment with higher highs, higher lows, and only shallow pullbacks into rising support. The nearest pivot reference is the prior high at 736.60 and the next swing low marker at 716.98, while deeper support sits at 695.25 and then the April base zone.
Chart Analysis ATS AI Generated: 2026-05-29 07:06 for Informational use only, not trading advice. Terms and Risk Disclosure Copyright © 2026. Algo Trading Systems LLC.