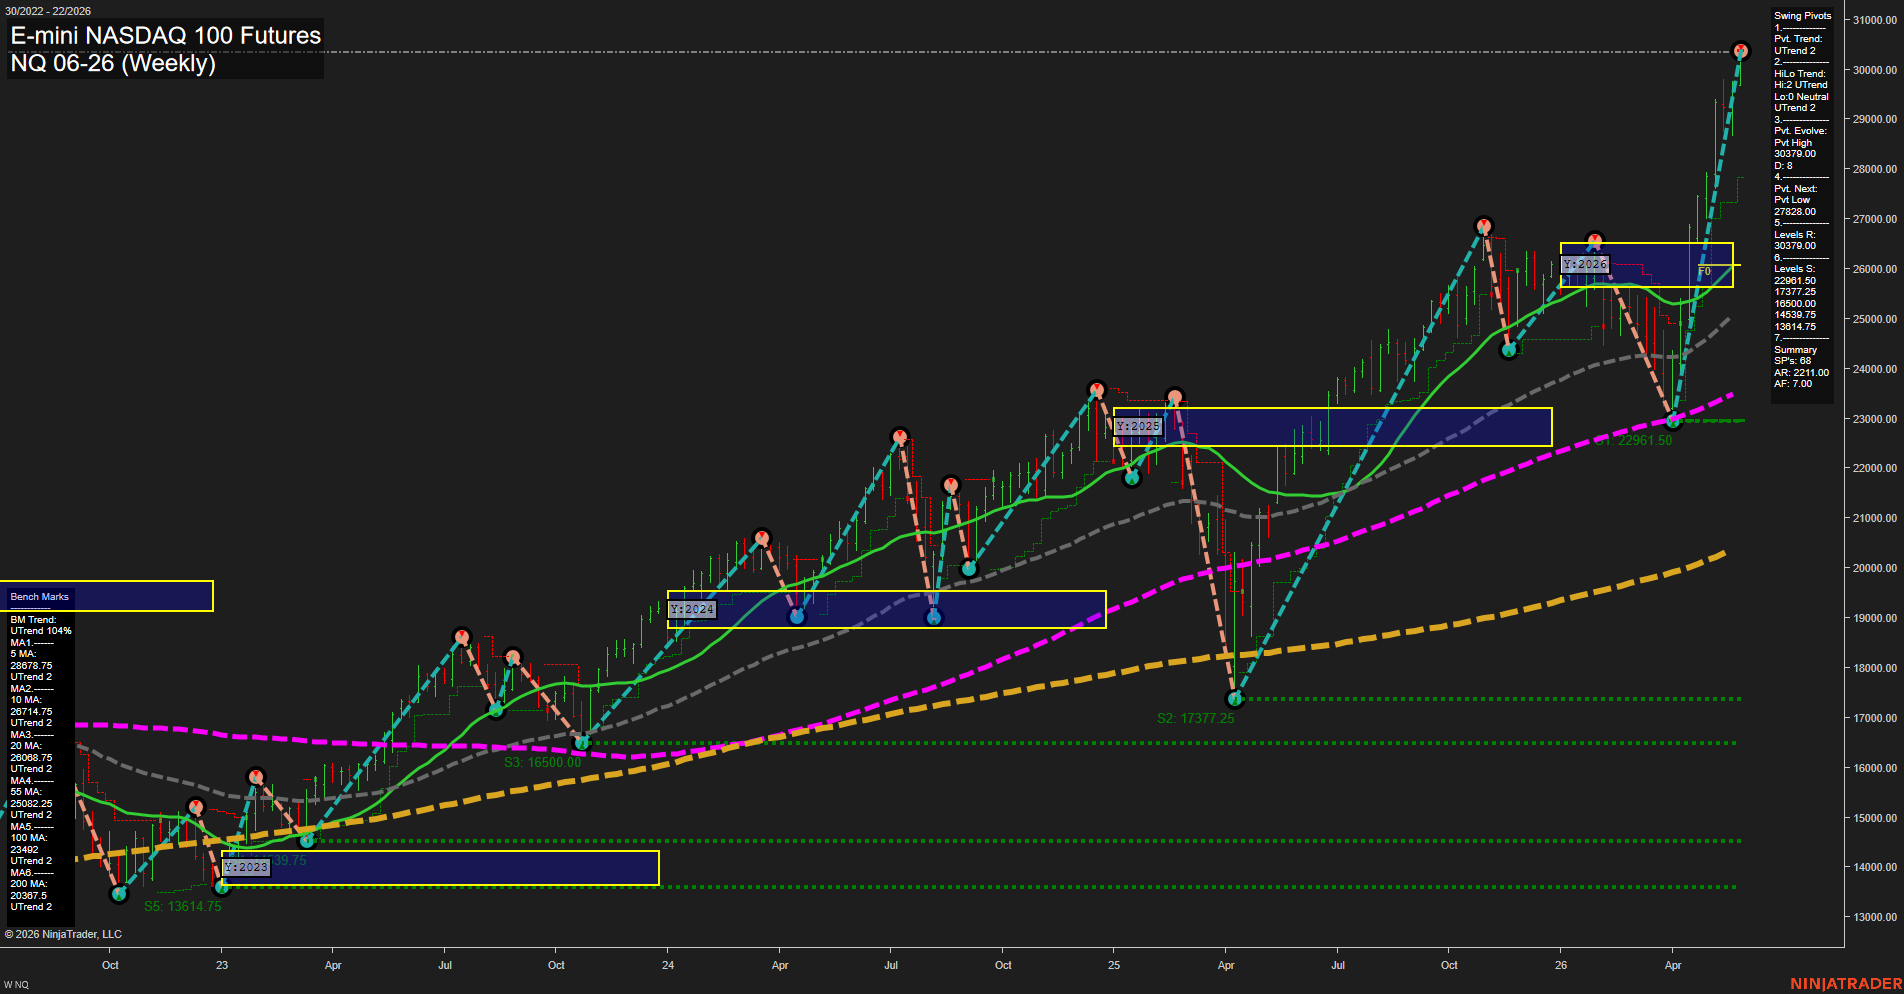
NQ E-mini NASDAQ 100 Futures Weekly Chart Analysis: 2026-May-29 07:06 CT
Price Action
- Last: 30379.00,
- Bars: Large,
- Mom: fast.
WSFG Weekly
- Short-Term
- WSFG Current: 57%
- F0%/NTZ' Bias: Price Above,
- WSFG Trend: Up.
MSFG Month May
- Intermediate-Term
- MSFG Current: 120%
- F0%/NTZ' Bias: Price Above,
- MSFG Trend: Up.
YSFG Year 2026
- Long-Term
- YSFG Current: 97%
- F0%/NTZ' Bias: Price Above,
- YSFG Trend: Up.
Swing Pivots
- (Short-Term) 1. Pvt. Trend: UTrend,
- (Intermediate-Term) 2. HiLo Trend: UTrend,
- 3. Pvt. Evolve: Pvt High 30379.00,
- 4. Pvt. Next: Pvt Low 27828.00,
- 5. Levels R: 30379.00,
- 6. Levels S: 22961.50, 17377.25, 16500.00, 14539.75, 13614.75.
Weekly Benchmarks
- (Short-Term) 5 Day: 28678.75 Up Trend,
- (Short-Term) 10 Day: 28714.75 Up Trend,
- (Intermediate-Term) 20 Day: 28068.75 Up Trend,
- (Intermediate-Term) 55 Day: 25082.25 Up Trend,
- (Long-Term) 100 Day: 23492.00 Up Trend,
- (Long-Term) 200 Day: 20387.50 Up Trend.
Recent Trade Signals
- 26 May 2026: Long NQ 06-26 @ 29825.25 Signals.USAR-WSFG
Overall Rating
- Short-Term: Bullish,
- Intermediate-Term: Bullish,
- Long-Term: Bullish.
Key Insights Summary
The weekly structure remains firmly aligned with trend continuation: price is pressing at new highs near 30379 after a strong impulsive rally, with large bars and fast momentum confirming expansion rather than compression. WSFG, MSFG, and YSFG are all above their F0%/NTZ centers and trending up, which keeps the short-, intermediate-, and long-term bias constructive. Swing pivots remain in UTrend, and the pivot sequence shows a completed push to a new high with the next downside pivot reference marked much lower at 27828, highlighting how extended the current advance is relative to prior swing supports. All benchmark moving averages are stacked below price and sloping up, reinforcing broad trend strength across the weekly, monthly, and yearly frames. The broader market texture is one of persistent higher highs and higher lows, with prior pullbacks resolving quickly and the current tape showing strong breakout behavior at the top of the yearly session structure.
Chart Analysis ATS AI Generated: 2026-05-29 07:06 for Informational use only, not trading advice. Terms and Risk Disclosure Copyright © 2026. Algo Trading Systems LLC.