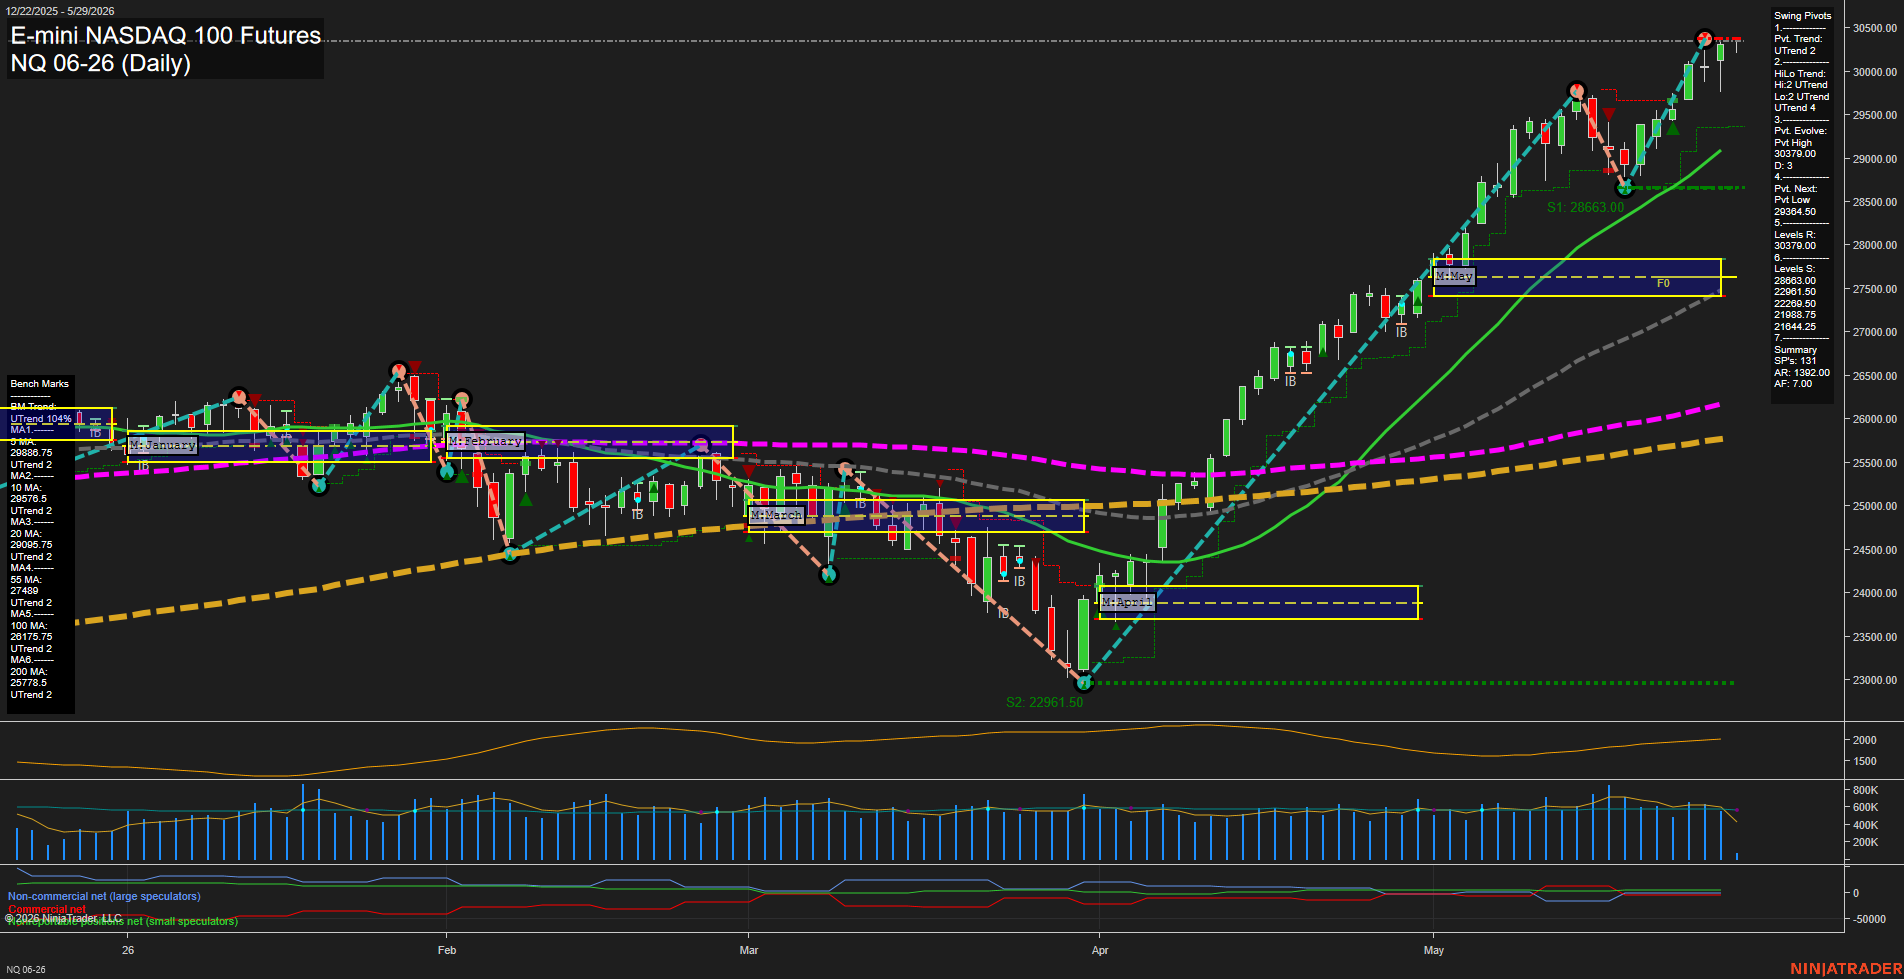
NQ E-mini NASDAQ 100 Futures Daily Chart Analysis: 2026-May-29 07:06 CT
Price Action
- Last: 30350.00,
- Bars: Large,
- Mom: fast.
WSFG Weekly
- Short-Term
- WSFG Current: 57%
- F0%/NTZ' Bias: Price Above,
- WSFG Trend: Up.
MSFG Month May
- Intermediate-Term
- MSFG Current: 120%
- F0%/NTZ' Bias: Price Above,
- MSFG Trend: Up.
YSFG Year 2026
- Long-Term
- YSFG Current: 97%
- F0%/NTZ' Bias: Price Above,
- YSFG Trend: Up.
Swing Pivots
- (Short-Term) 1. Pvt. Trend: UTrend,
- (Intermediate-Term) 2. HiLo Trend: UTrend,
- 3. Pvt. Evolve: Pvt High 30379.00,
- 4. Pvt. Next: Pvt Low 29364.50,
- 5. Levels R: 30379.00,
- 6. Levels S: 28663.00, 22961.50, 22269.50, 21988.75, 21644.25.
Daily Benchmarks
- (Short-Term) 5 Day: 29886.75 Up Trend,
- (Short-Term) 10 Day: 29576.50 Up Trend,
- (Intermediate-Term) 20 Day: 29055.75 Up Trend,
- (Intermediate-Term) 55 Day: 27489.00 Up Trend,
- (Long-Term) 100 Day: 26175.75 Up Trend,
- (Long-Term) 200 Day: 25778.50 Up Trend.
Additional Metrics
- ATR: 1618,
- VOLMA: 626746.
Recent Trade Signals
- 26 May 2026: Long NQ 06-26 @ 29825.25 Signals.USAR-WSFG
Overall Rating
- Short-Term: Bullish,
- Intermediate-Term: Bullish,
- Long-Term: Bullish.
Key Insights Summary
The daily chart remains in a strong upside expansion phase, with price pressing into fresh highs above all benchmark moving averages and holding well above the monthly and yearly session fib grids. Short-term structure is firmly in UTrend, and the swing pivot sequence continues to favor higher highs and higher lows, with the latest pivot high at 30379 and the next downside reference at 29364.50. The benchmark stack is fully bullish, showing a clear trend hierarchy from the 5-day through the 200-day average, which supports persistent trend continuation behavior. Recent price action shows a powerful rally leg with large daily bars and fast momentum, following a sharp V-shaped recovery from the April low area near 22961.50 and extending through the May consolidation zone into breakout territory. The current tape reflects strong trend continuation with overhead resistance now concentrated near the prior swing high zone, while the broader structure remains constructive across weekly, monthly, and yearly session fib measures.
Chart Analysis ATS AI Generated: 2026-05-29 07:06 for Informational use only, not trading advice. Terms and Risk Disclosure Copyright © 2026. Algo Trading Systems LLC.