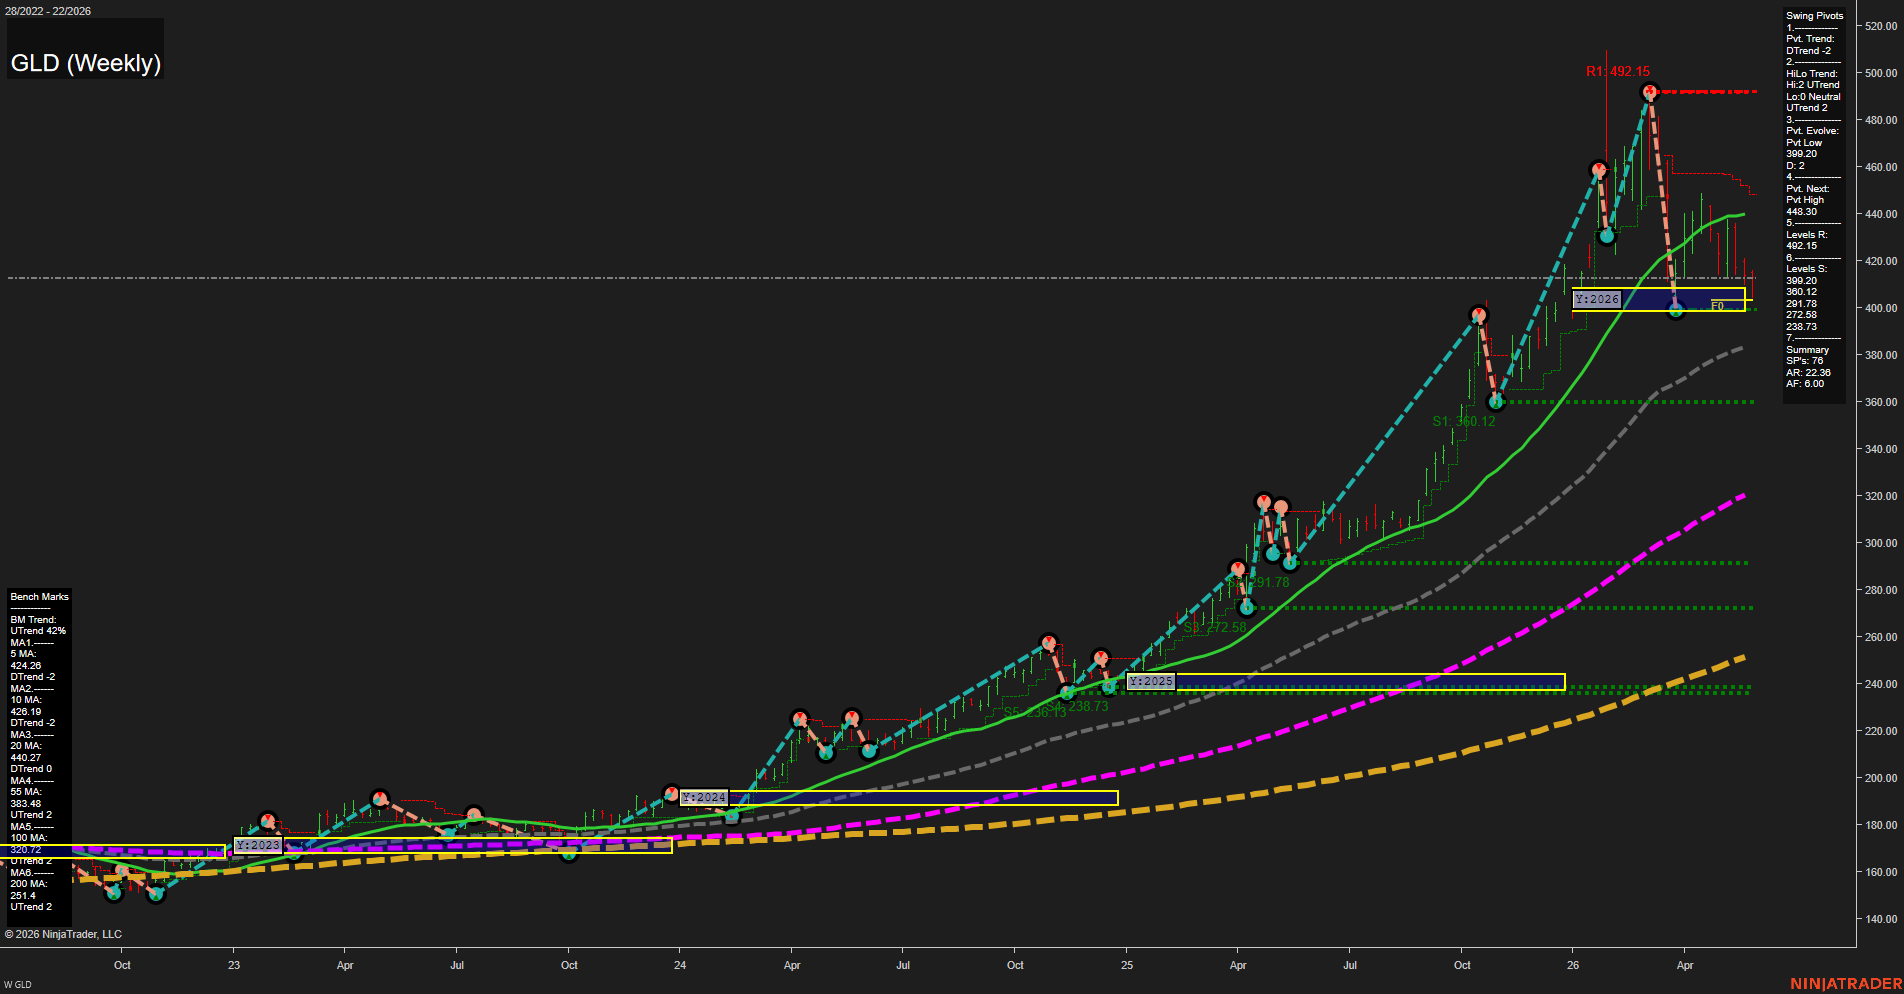
GLD SPDR Gold Shares Weekly Chart Analysis: 2026-May-29 07:04 CT
Price Action
- Last: 412.00,
- Bars: Large,
- Mom: slow.
WSFG Weekly
- Short-Term
- WSFG Current: NA%
- F0%/NTZ' Bias: Price Neutral,
- WSFG Trend: Neutral.
MSFG Month May
- Intermediate-Term
- MSFG Current: NA%
- F0%/NTZ' Bias: Price Neutral,
- MSFG Trend: Neutral.
YSFG Year 2026
- Long-Term
- YSFG Current: NA%
- F0%/NTZ' Bias: Price Neutral,
- YSFG Trend: Neutral.
Swing Pivots
- (Short-Term) 1. Pvt. Trend: DTrend,
- (Intermediate-Term) 2. HiLo Trend: UTrend,
- 3. Pvt. Evolve: Pvt Low 399.20,
- 4. Pvt. Next: Pvt High 448.30,
- 5. Levels R: 492.15,
- 6. Levels S: 399.20, 360.12, 291.78, 272.58, 238.73.
Weekly Benchmarks
- (Short-Term) 5 Day: 424.26 Down Trend,
- (Short-Term) 10 Day: 426.19 Down Trend,
- (Intermediate-Term) 20 Day: 440.27 Down Trend,
- (Intermediate-Term) 55 Day: 383.48 Up Trend,
- (Long-Term) 100 Day: 320.72 Up Trend,
- (Long-Term) 200 Day: 251.40 Up Trend.
Overall Rating
- Short-Term: Bearish,
- Intermediate-Term: Neutral,
- Long-Term: Bullish.
Key Insights Summary
GLD remains in a dominant long-term uptrend, but the weekly structure is in a corrective phase after a strong vertical advance into the 490s. The swing pivot trend is bearish on the short-term while the HiLo trend still holds constructive intermediate strength, showing the market is working off the prior surge rather than fully reversing it. Price is trading below the short-term benchmarks and below the prior pivot high area, which reflects cooling momentum and a rotation from breakout extension into pullback/consolidation behavior. The 55, 100, and 200 week benchmarks remain rising, keeping the broader trend aligned to the upside, while the current retracement has brought price back toward the upper part of the prior year’s NTZ/F0 zone. The chart reflects a sharp rally, a rounded pause, and a recent retracement from the highs, with the prior expansion phase now transitioning into digestion and balance.
Chart Analysis ATS AI Generated: 2026-05-29 07:04 for Informational use only, not trading advice. Terms and Risk Disclosure Copyright © 2026. Algo Trading Systems LLC.