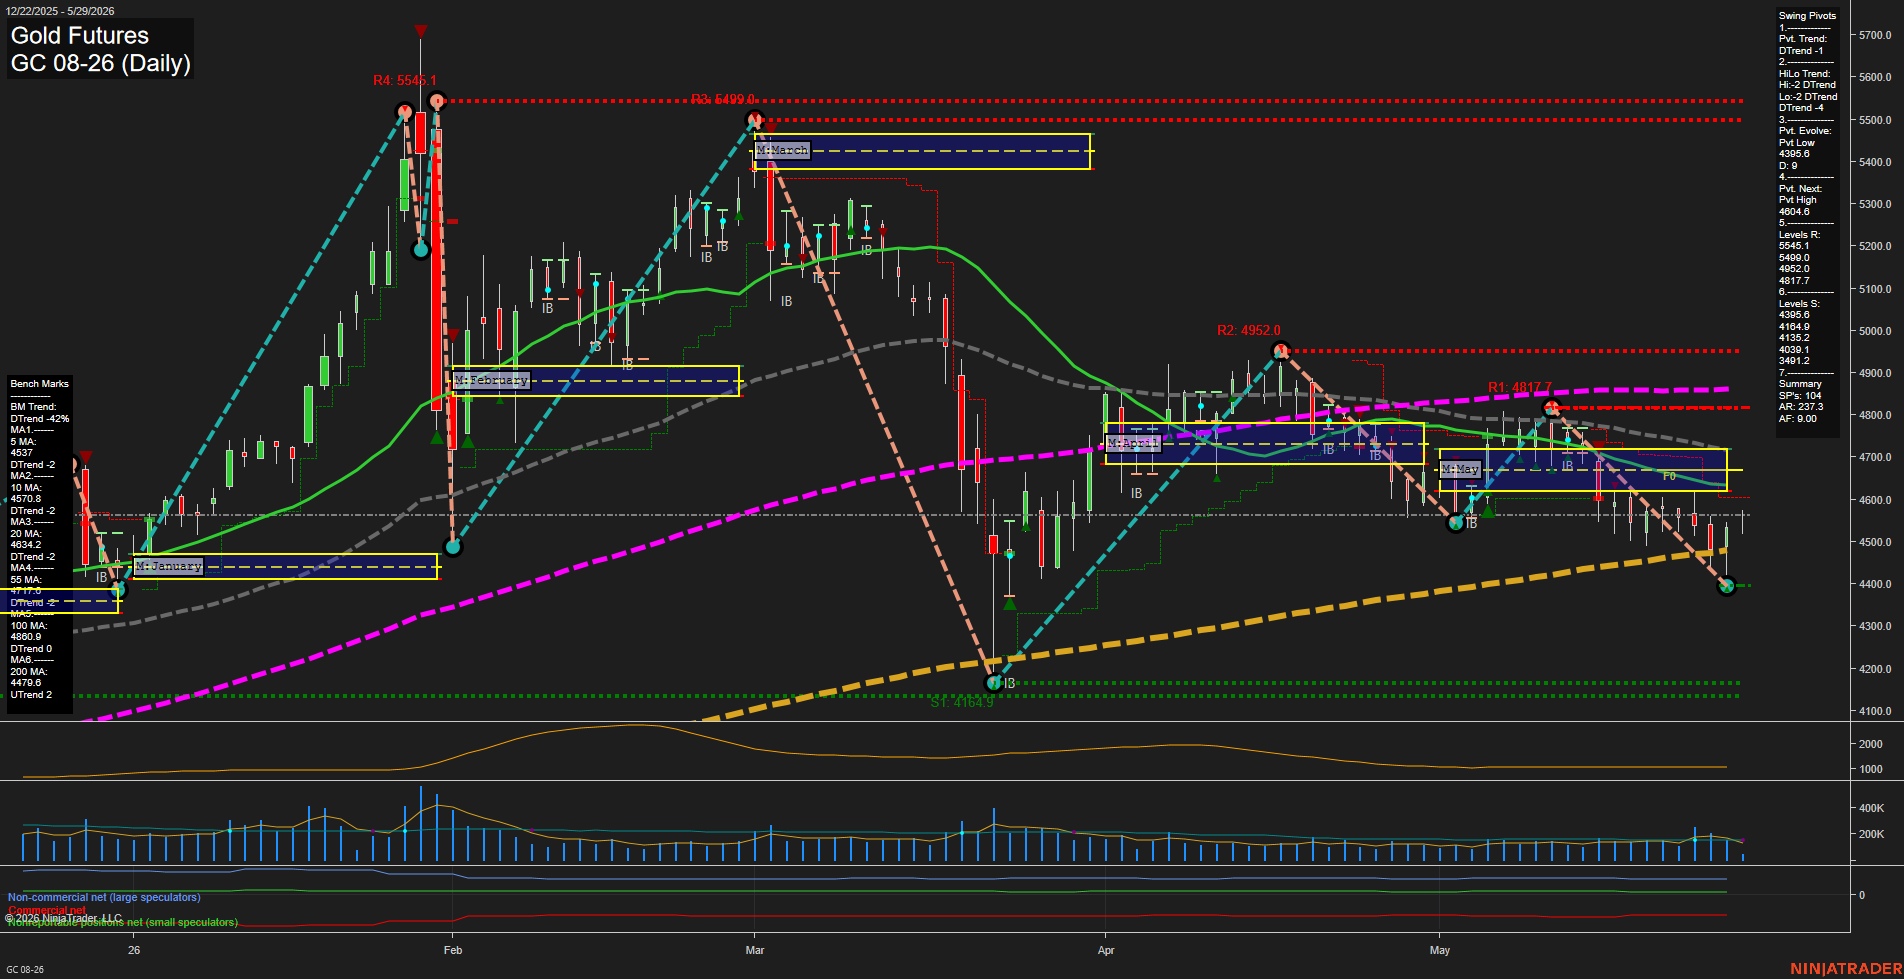
GC Gold Futures Daily Chart Analysis: 2026-May-29 07:03 CT
Price Action
- Last: 4496.4,
- Bars: Large,
- Mom: Fast.
WSFG Weekly
- Short-Term
- WSFG Current: 1%
- F0%/NTZ' Bias: Price Above,
- WSFG Trend: Up.
MSFG Month May
- Intermediate-Term
- MSFG Current: -12%
- F0%/NTZ' Bias: Price Below,
- MSFG Trend: Down.
YSFG Year 2026
- Long-Term
- YSFG Current: -19%
- F0%/NTZ' Bias: Price Below,
- YSFG Trend: Down.
Swing Pivots
- (Short-Term) 1. Pvt. Trend: DTrend,
- (Intermediate-Term) 2. HiLo Trend: DTrend,
- 3. Pvt. Evolve: Pvt Low 4395.6,
- 4. Pvt. Next: Pvt High 4604.6,
- 5. Levels R: 5545.1, 5499.0, 4952.0, 4817.7,
- 6. Levels S: 4395.6, 4164.9, 4135.2, 4039.1, 3491.2.
Daily Benchmarks
- (Short-Term) 5 Day: 4537.0 Down Trend,
- (Short-Term) 10 Day: 4570.8 Down Trend,
- (Intermediate-Term) 20 Day: 4634.2 Down Trend,
- (Intermediate-Term) 55 Day: 4757.0 Down Trend,
- (Long-Term) 100 Day: 4860.9 Down Trend,
- (Long-Term) 200 Day: 4479.6 Up Trend.
Additional Metrics
Recent Trade Signals
- 28 May 2026: Long GC 08-26 @ 4539.2 Signals.USAR.TR120
- 27 May 2026: Short GC 06-26 @ 4480.1 Signals.USAR-MSFG
- 27 May 2026: Short GC 06-26 @ 4496.4 Signals.USAR-WSFG
Overall Rating
- Short-Term: Bearish,
- Intermediate-Term: Bearish,
- Long-Term: Neutral.
Key Insights Summary
Gold futures are trading in a fast downside swing with price pressed below the short- and intermediate-term benchmark averages, while the daily pivot structure remains in DTrend and the next pivot focus is a higher swing high near 4604.6. The weekly fib grid still holds an upward bias, but the monthly and yearly session grids remain below their f0% zones with down trends, keeping the larger backdrop corrective to bearish. Recent price action shows a sharp retracement from the 4800-4950 resistance zone toward the 4400 area, with the current bar sitting near support derived from the latest pivot low region and the 200-day benchmark. The setup reflects a volatile pullback inside a broader two-sided sequence, with overhead resistance clustered at 4817.7, 4952.0, and 5499.0, while downside reference levels remain layered at 4395.6, 4164.9, and 4039.1.
Chart Analysis ATS AI Generated: 2026-05-29 07:04 for Informational use only, not trading advice. Terms and Risk Disclosure Copyright © 2026. Algo Trading Systems LLC.