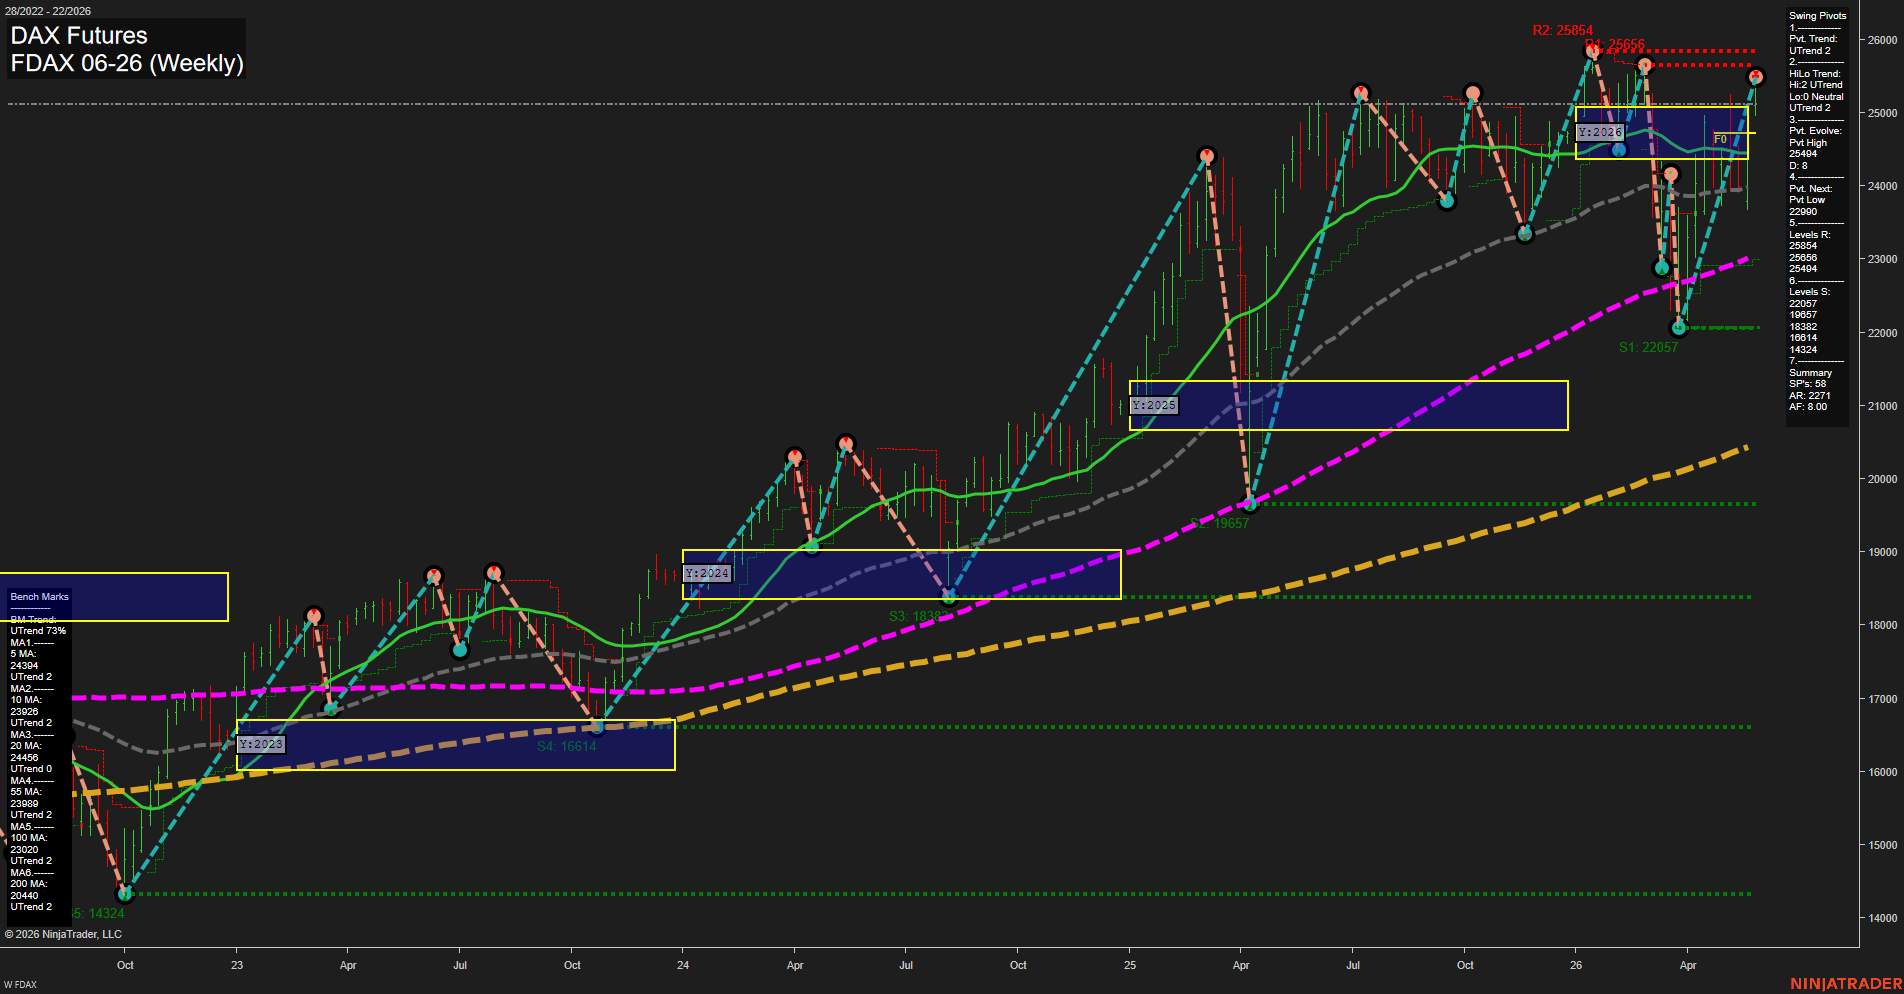
FDAX DAX Futures Weekly Chart Analysis: 2026-May-29 07:03 CT
Price Action
- Last: 25479,
- Bars: Large,
- Mom: Fast.
WSFG Weekly
- Short-Term
- WSFG Current: 4%
- F0%/NTZ' Bias: Price Above,
- WSFG Trend: Up.
MSFG Month May
- Intermediate-Term
- MSFG Current: 36%
- F0%/NTZ' Bias: Price Above,
- MSFG Trend: Up.
YSFG Year 2026
- Long-Term
- YSFG Current: 11%
- F0%/NTZ' Bias: Price Above,
- YSFG Trend: Up.
Swing Pivots
- (Short-Term) 1. Pvt. Trend: UTrend,
- (Intermediate-Term) 2. HiLo Trend: UTrend,
- 3. Pvt. Evolve: Pvt High 25494,
- 4. Pvt. Next: Pvt Low 22990,
- 5. Levels R: 25854, 25656, 25494,
- 6. Levels S: 22057, 19857, 18382, 16614, 14324.
Weekly Benchmarks
- (Short-Term) 5 Day: 24394 Up Trend,
- (Short-Term) 10 Day: 23926 Up Trend,
- (Intermediate-Term) 20 Day: 24456 Up Trend,
- (Intermediate-Term) 55 Day: 23989 Up Trend,
- (Long-Term) 100 Day: 23020 Up Trend,
- (Long-Term) 200 Day: 20440 Up Trend.
Recent Trade Signals
- 28 May 2026: Short FDAX 06-26 @ 25099 Signals.USAR.TR120
- 25 May 2026: Long FDAX 06-26 @ 25226 Signals.USAR-WSFG
- 22 May 2026: Long FDAX 06-26 @ 24823 Signals.USAR-MSFG
Overall Rating
- Short-Term: Bullish,
- Intermediate-Term: Bullish,
- Long-Term: Bullish.
Key Insights Summary
Weekly FDAX remains in a strong structural uptrend with price holding above the yearly, monthly, and weekly fib grid midlines and trading near the upper end of the current range. The pivot structure is still bullish, with the active swing sequence pressing toward a fresh high pivot near 25494 and overhead resistance layered at 25656 and 25854. The benchmark stack is fully supportive, with all tracked moving averages trending up and price positioned well above the longer-term averages, confirming positive trend alignment across timeframes. The recent signal sequence shows a short-term countertrend short against an otherwise constructive backdrop, while the prior WSFG and MSFG longs fit the broader trend continuation theme. Overall, the chart reflects an extended but still trend-dominant rally with higher highs and higher lows, now testing the upper weekly range after a strong multi-month advance.
Chart Analysis ATS AI Generated: 2026-05-29 07:03 for Informational use only, not trading advice. Terms and Risk Disclosure Copyright © 2026. Algo Trading Systems LLC.